
Amazon Annual Report: Financial Overview & Analysis 2019
Amazon is one of the most valuable companies in the world. It became a household name associated with a wide selection of goods, low prices, and quick delivery. Amazon is dominating e-commerce business and has recently started also creative disruption in physical retail and other areas.
Amazon is a unique company, and its financial statements and annual report reflect that. Even after 25+ years in business, Amazon still focuses on growth, does not return money to investors, and primarily reinvests an increasing amount of cash back into the business.
The main thing to realize is that Amazon’s core business is not selling stuff online anymore. At least not directly. It pivoted to offering Amazon.com as a platform for other companies to use.
In this article, I will walk you through Amazon’s financial statements from its annual report, using charts and key takeaways. After that, we will look at more detail on individual revenue streams and see how different parts of Amazon’s business generate revenue.
I want to present you the financial numbers in a simple and visual way, but also help you tie the numbers to the “business” behind them.
Let’s start with a quick overview of what business Amazon is really in. Amazon’s business model shifted significantly. Although it still focuses on retail business, its core business is no longer selling goods online.
🏢 What Business is Amazon In? (Quick Overview)
Amazon is a formidable company that, even after 25+ years, constantly innovates and pushes the online e-commerce and recently also physical retail business ahead. As Jeff Bezos, Amazon founder & CEO, often says in his interviews, one of the original ideas on how to name Amazon was relentless.com.
They then chose a more appropriate name, “Amazon.com.” But looking back, we can now see that although the company was not named “relentless,” it was and still is relentless in the way it operates.
So what business is Amazon in, and what it actually does?
Even though Amazon started as an online bookstore and later as an online “everything” store that sells directly to customers, this business model is history.
Currently, nearly 60% of physical product sales on Amazon are items sold by other third party businesses, not Amazon itself.
Amazon business pivoted from selling stuff online into an e-commerce infrastructure provider, helping businesses to sell goods online. Amazon will handle everything from storage, delivery, payment, and even offer you advertising or financing.
Amazon today is a company that rents tools for businesses that allow them to sell stuff online. And, even more importantly, provide them access to Amazon’s biggest asset, its customers.
Before Amazon’s business model shifted to providing a marketplace, it was hard to see how Amazon is planning to make any significant money from its business. Its new focus looks like a much more profitable business model, and Amazon is currently one of the most valuable companies in the world.
Amazon’s actual profits, even in 2019, were not very huge since it still heavily invests a lot of money back into the company and continues building its infrastructure.
In the following older video, Jeff Bezos talks about Amazon, its vision, and how they approach their business. The central theme that pop-ups several times is “obsessive focus on the customer.”
As is evident from this interview and other older ones, it seems that Amazon did not have any master plan from day one how they will make money. They wanted to focus on the customer and figure out how to make money from it later by trying out different things and building on top of those that worked. And that is what happened.
Prime membership, AWS, and access to Amazon by third-party sellers were few of those experiments that at the end worked out. These experiments changed Amazon from an online retailer to an online retail platform with its fulfillment centers, planes, trucks, and delivery vans.
Something that looked like a bunch of weakly related investments had finally come together and turned Amazon into what it is now.
For years and even in 2019, the most profitable part of Amazon’s business was AWS, its cloud services. Amazon will probably never make significant money directly from selling stuff online. Profit will come from services for third-party sellers, AWS, and probably also advertising.
Before we dig deeper into Amazon’s financial statement, let’s look at Amazon’s revenue breakdown that should give us a rough idea about where Amazon’s revenue is coming from.
The chart below shows different revenue streams as % of the total. Note that absolute revenue, as reported in Amazon’s annual reports, went from $107bn in 2015 to $281bn in 2019, so even the items that had a decreasing share on total (like online stores) grew significantly in dollar amounts. Right now, let’s focus on % shares.
Breakdown of Amazon’s Current Business
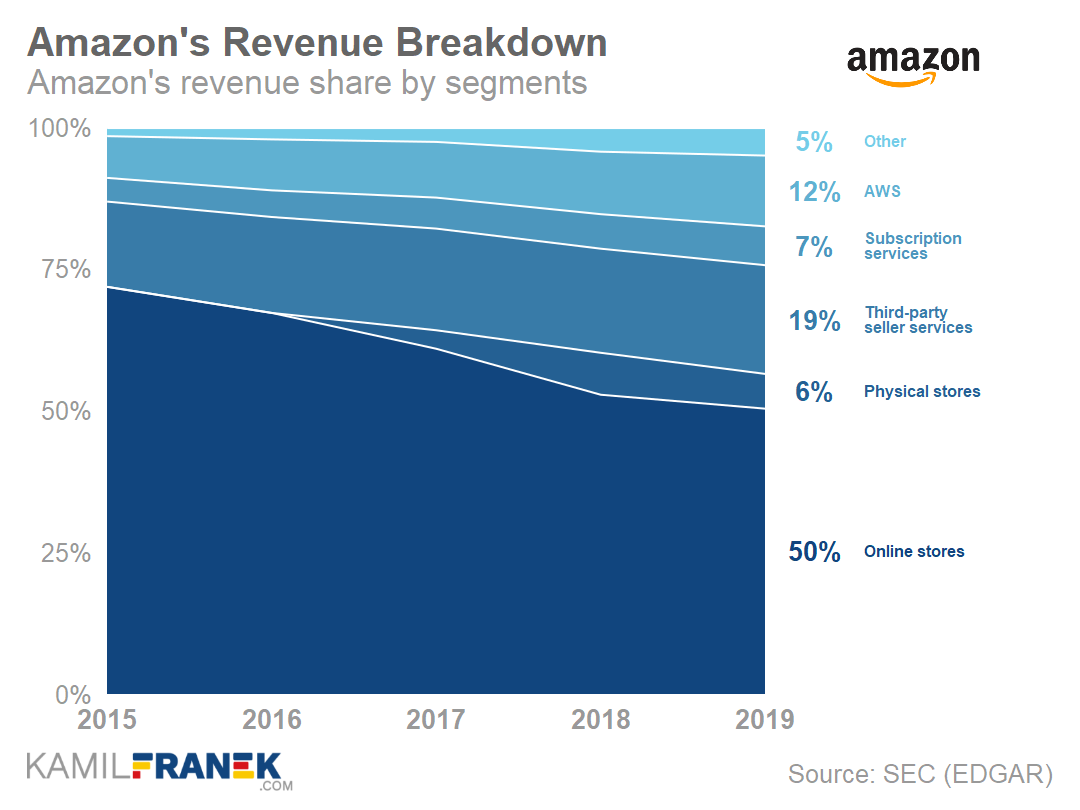
As you can see above, Amazon’s revenue is coming from the following sources:
- 50% of revenue (not profits!) is coming from online stores. This represents the value of goods that Amazons sells directly to its customers. Currently, online stores are the biggest part of revenue, but looking at the trend, it is clear that it will not be the biggest part of revenue for a long time.
- The second biggest revenue source is third-party seller services. This revenue represents fees that other businesses pay to Amazon for access to its customers and for fulfilling customer orders, handling returns, and other services. It is only 19% of revenue, but we have to consider that this is only the value of fees Amazon charges, not the full price of the product sold. Currently, on Amazon, third parties sell 60% of goods.
- The third important revenue stream is Amazon Web Services (AWS), where Amazon charges businesses for using its cloud infrastructure and services. For a long time, AWS was the only part of the business that was making a significant profit. Without AWS, Amazon would be loss-making until 2017.
Revenue streams mentioned above (online stores, third-party services, AWS) currently make more than 80% of total revenue. Other revenue streams, like Subscription services, Physical Stores, and Other (mostly advertising), are presently small. Still, based on Amazon’s recent actions, they might play a more prominent role in the coming years.
Amazon has achieved great things so far, but if you look at their latest moves, it seems that they are just getting started. They are growing their infrastructure and becoming more active in physical retail and advertising. Moreover, Amazon even internalized most of its delivery services by operating its planes, trucks, and vans.
Amazon has a dominant position in e-commerce (37% market share in 2019). But if you look at its share on the US retail market, its share is just 4%. Walmart is still the main player in US retail.
Amazon also has many challenges ahead, and it is not guaranteed that their winning streak will continue. Amazon turned from David to Goliath of the retail business. Although dominance brings certain advantages, there is also a price attached to that.
What can we expect from Amazon in the future?
The first thing that I am looking forward to seeing and expecting to be very successful is Amazon’s advertising business growth. Amazon is well-positioned to revolutionize advertising and push its level of integration with e-commerce. They have all the pieces ready. They just need to string them together and push ahead.
By that, I mean integrating advertising with content that Amazon already offers on its streaming services and offering an easy way to order promoted products directly from Amazon.
It can happen either by using your Fire TV remote or saying, “Alexa, buy me that thing.” Apart from that, Amazon streaming content alone is a great acquisition channel for Prime members. The video below offers a peek into Amazon’s media strategy.
Another thing to watch for in the coming years is Amazon’s push into a physical retail business through its own stores, especially Whole Food, that they acquired in 2017 or Amazon Fresh. But the main potential might come from renting out Amazon in-store cashier-less technology to other physical retailers.
For some time, Amazon was testing its cashier-less technology in its Amazon Go stores. It recently launched Amazon Fresh stores, where you can use Amazon Dash Cart that Amazon developed. Amazon already officially offers this service to other businesses as a service at justwalkout.com.
Amazon is well-positioned to provide excellent customer experience by merging online and offline word together. All of those things above and a combination of online retail, offline retail, and in-content advertising will allow Amazon to have even bigger insight into customer behavior through data it can collect.
But not everything is just sunshine for Amazon in the future. One challenge that lies ahead of Amazon is that thanks to its size, it will be under more scrutiny than before. Some of its activities are already investigated for potential conflict of interest. Even if it avoids being broken up, it will slow Amazon down, and its giant size will limit its options.
Another reason why Amazon’s growth might slow down, and its journey for higher profits will be challenged, are its re-energized competitors. Amazon is no longer underestimated as before. Walmart, Amazon’s biggest competitor in the US, looks like it finally figured out how to do e-commerce and is moving into Amazon’s territory.
Amazon’s challenges are not limited to the US market. It exited the China marketplace last year after 15 years of trying. Amazon was not able to win in China thanks to fierce competition and reportedly also thanks to Amazon’s attempts to run China business from US headquarters.
Even current attempts to double down on the Indian market might backfire. Not only because of competition but also thanks to political risks.
There are also new services like Shopify that offer non-branded services for business to build their own online presence very easily.
Both big and small businesses with strong retail brands have started to focus more on building their relationships with customers and staying away from Amazon. They correctly realize that it might not be in their best long term interest to sell their products there.
This Economist Radio episode very well describes the challenges with AWS, the Indian market, and re-energized competition. However, I disagree with them that the AWS spin-off is such a no-brainer. I don’t think it would be a move that would make good business sense for Amazon’s at this time.
For people interested in more backround information, including many controversies about Amazon, I recommend this documentary by Frontline.
For those of you who don’t want to spend nearly two hours watching it, this Wikipedia article about Amazon should make you covered.
✈️ Overview of Amazon’s Financial Statements (Summary Charts & Key Takeaways)
In this part of the article, I will offer you a bird eyes view of the main development within Amazon’s financials. We will cover a visual summary of key Amazon’s annual report financial statements (Income statement, balance sheet, cash flow statement) and also key points to take away from them.
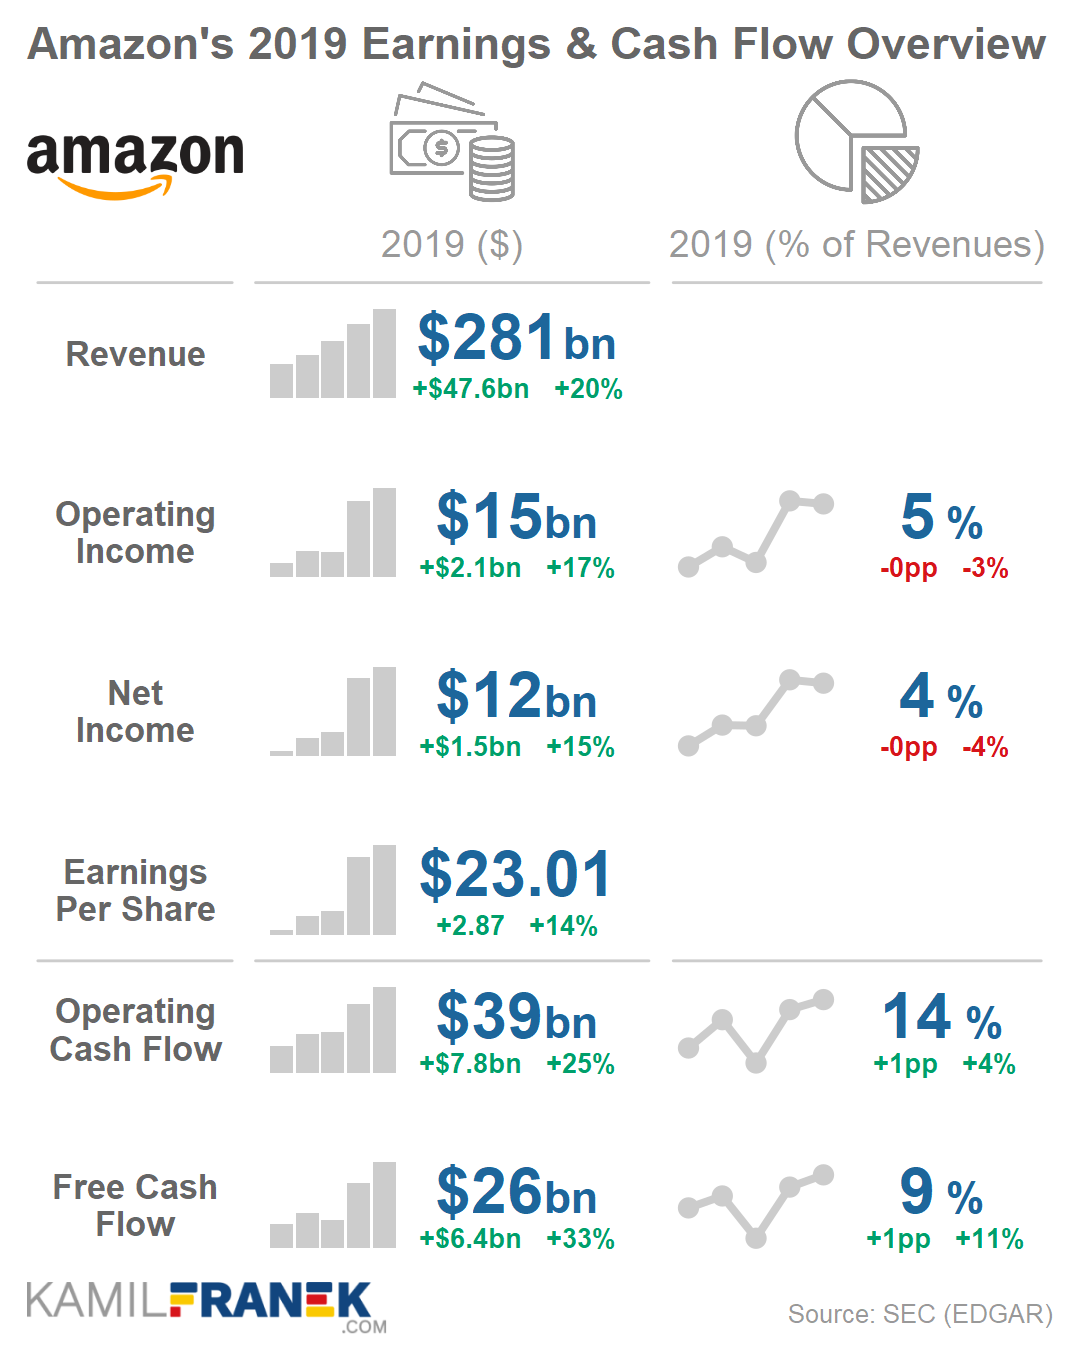
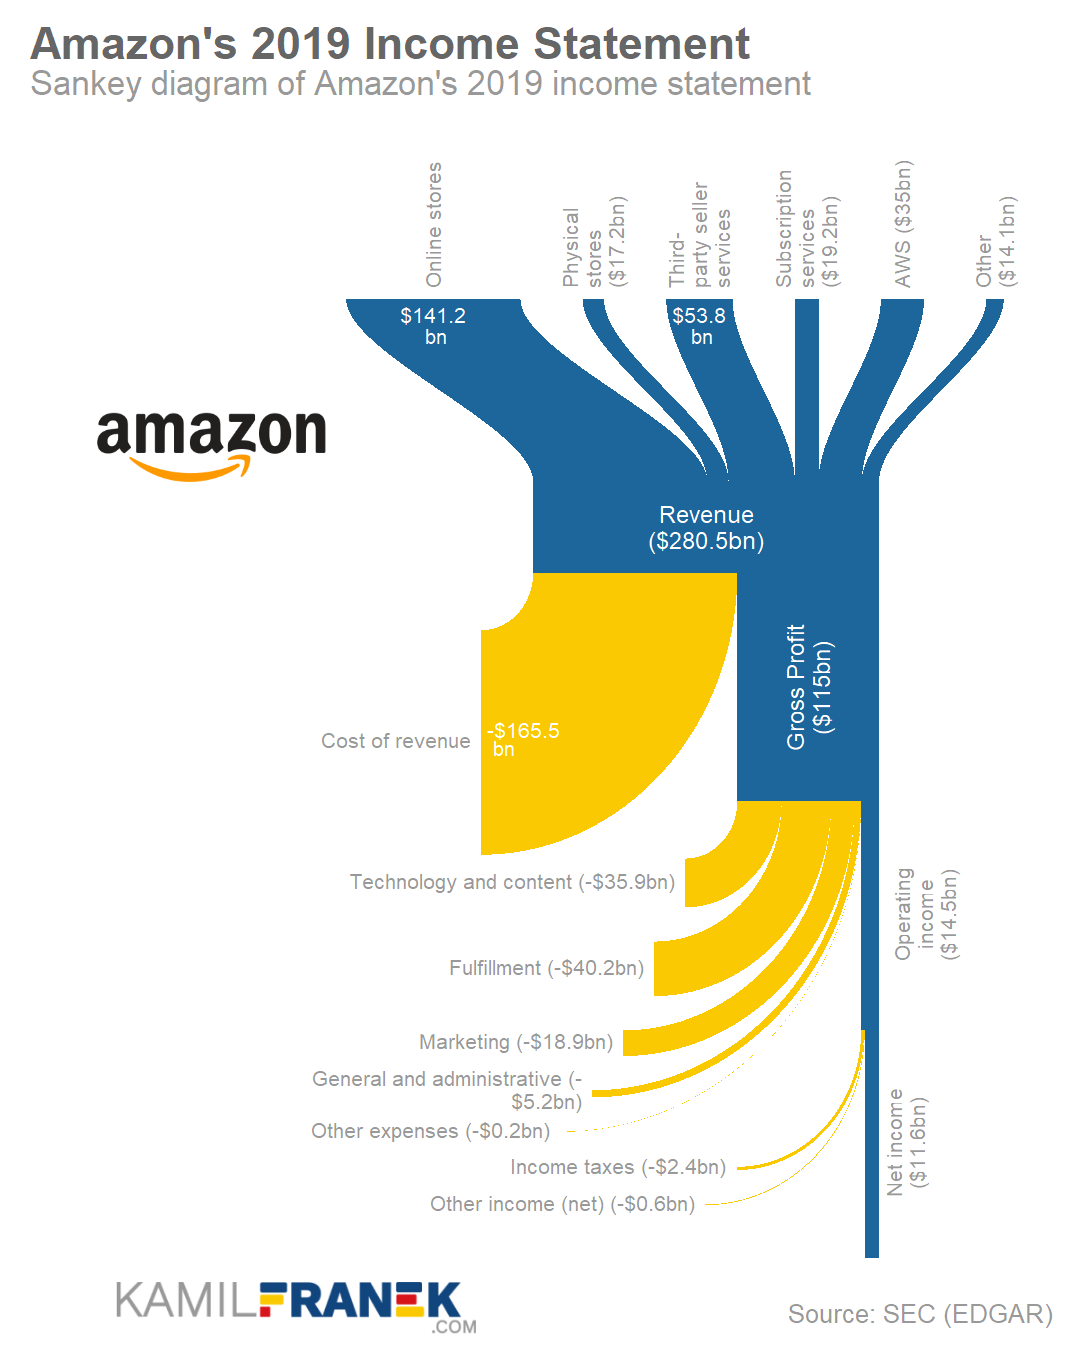
Overall, Amazon is not a very profitable business. 50% of Amazon’s $281bn revenues in 2019 came from selling stuff directly to customers for low prices and mostly free shipping, which is not a very profitable business. The main sources of Amazon’s profits are third-party seller services and AWS.
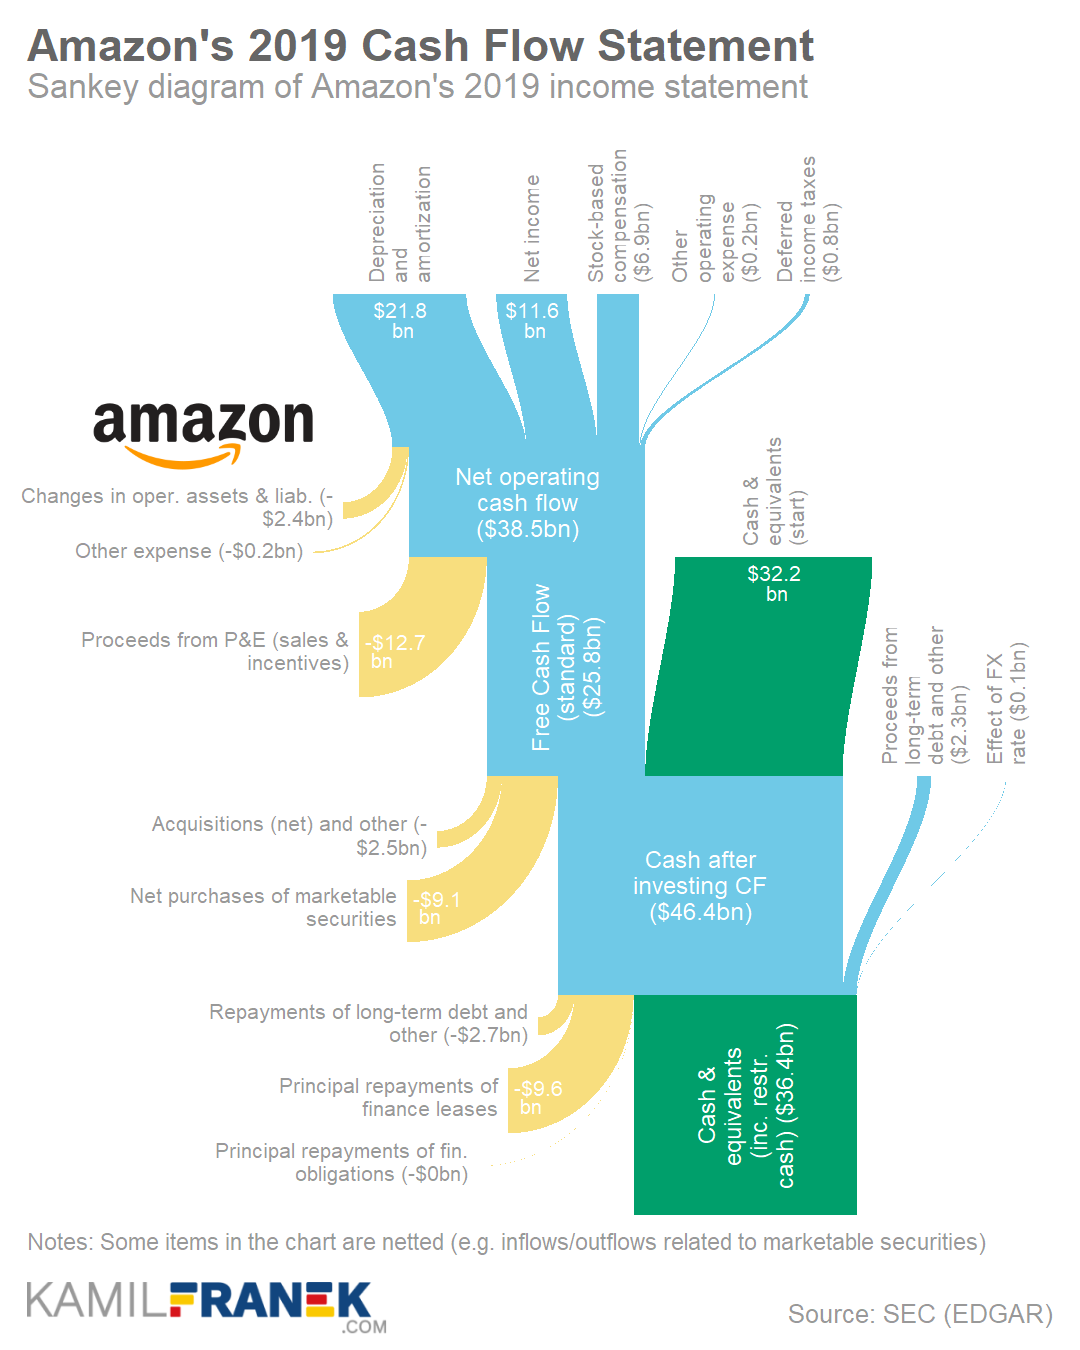
Amazon’s operating cash flow was $39bn in 2019. But if you calculate Amazon’s free cash flow correctly and adjust it for lease financed investment and stock-based compensation, you will find out that Amazon’s free cash flow is negative. That is thanks to Amazon’s high level of investments in its fulfillment, logistics, and server capacity.
In case you are not familiar with the visualizations that I use in this article, I published the post “7 Best Charts for Income Statement Presentation & Analysis.” I explain there most of the financial statements visualizations that I use here.
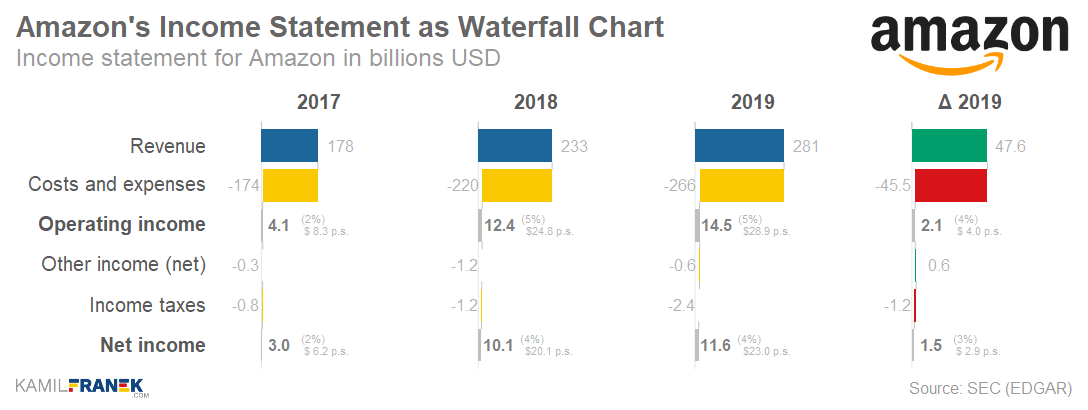
How Much Revenue and Profits Amazon Earned and Where it Comes From (Income Statement Overview)
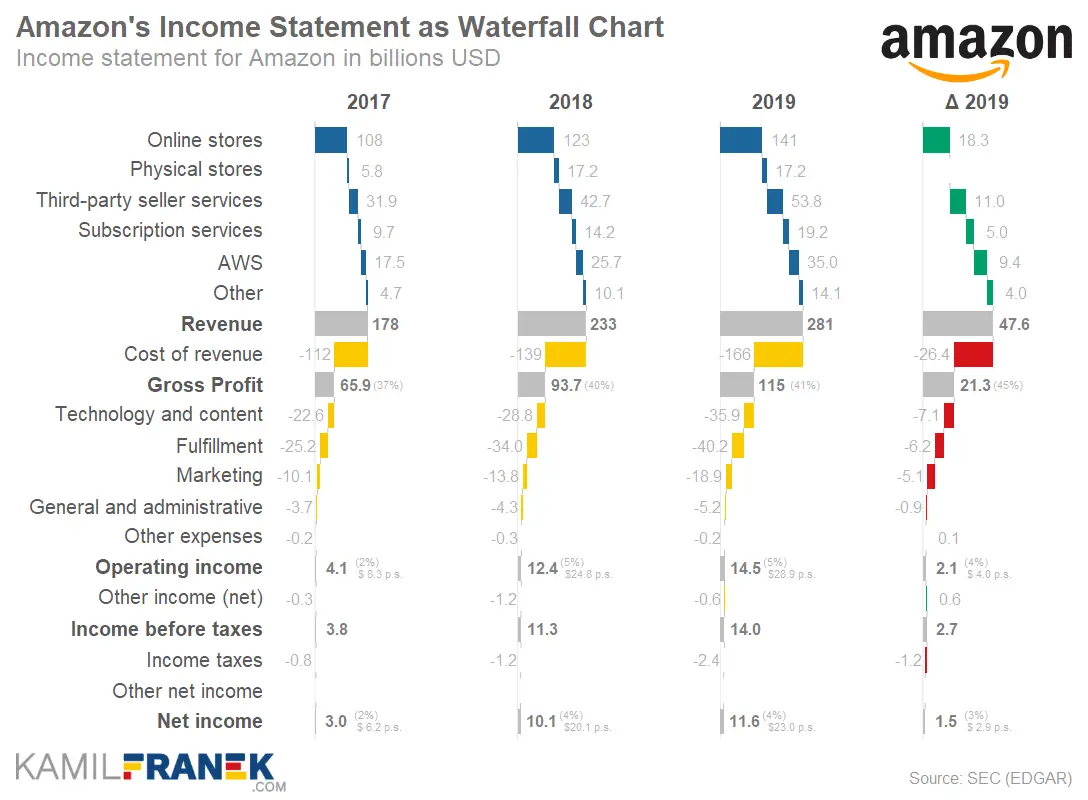
- Amazon’s revenue increased by $48bn in 2019 (20% growth) to $281 bn. The Biggest driver of this $48bn revenue growth was “online store” (+$18bn) that represents stuff directly sold by Amazon.
- Other important growth contributors apart from “online store” were third-party sellers services (+$11bn) and AWS (+$9bn)
- Total revenue grew by +20% in 2019, which was a result of slower growth (+14%) of direct online store sales and quicker growth of third party services (26%), AWS (37%) advertising (39%), and subscription services (36%). The only revenue stream that did not grow at all was the physical store revenue stream.
- Growth of revenue in 2017 nad 2018 was influenced by Whole Food acquisition and distorted comparison of long term growth rates. By excluding physical stores from revenue, we can see that Amazon’s revenue growth is slowly decreasing from 27% in 2017 to 25% growth in 2018 and 22% in 2019.
- Amazon.com sells nearly 60% of physical merchandise through its third-party seller marketplace. Amazon’s direct online store revenue is decreasing but is still 50% of the total. Amazon reports as revenue only fees third-party sellers pay to Amazon, not a full value of goods sold.
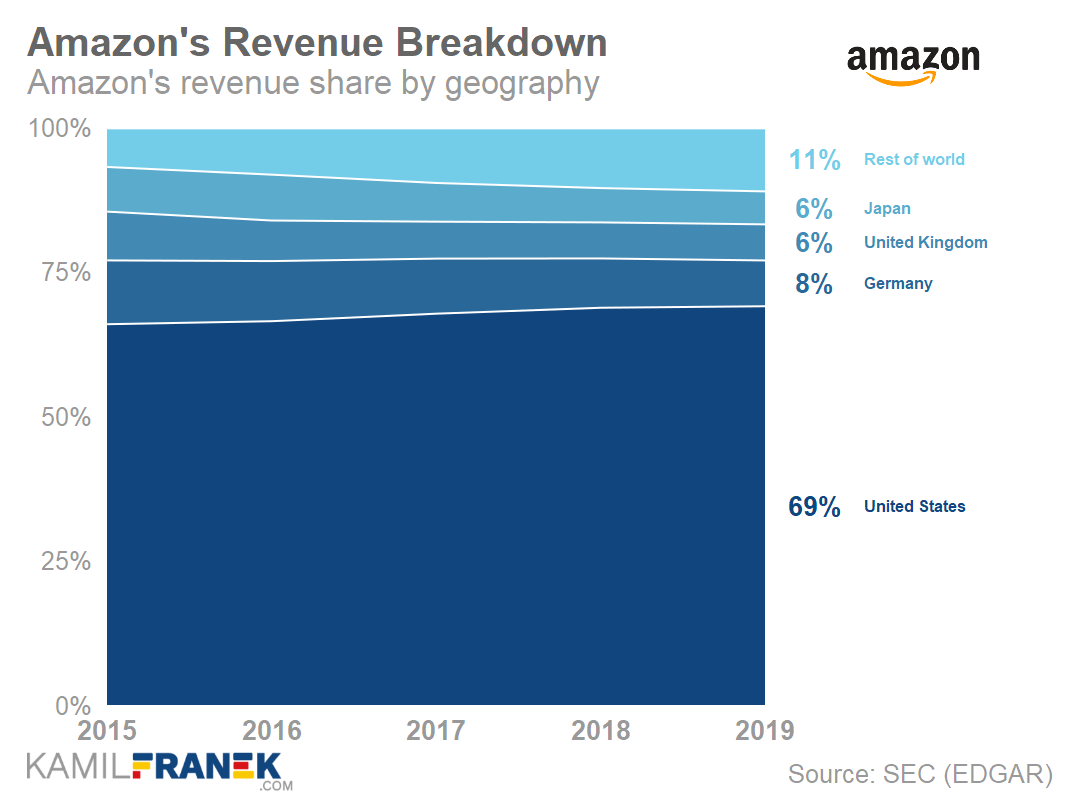
- 69% of Amazon revenue is coming from the US, and share of the US is increasing. The second biggest market is Germany, with a 9% share on revenues.
- Amazon invested a lot of money in its own logistic network and currently delivers around 2/3 of its US packages. It has its own planes, delivery trucks, and vans. Additional to that, it also uses third party contractors, especially for its last-mile delivery.
- Amazon’s Operating income was $15bn (+17% growth) in 2019, and the most significant contributor was, similar to previous years, the Amazon Web Services segment (AWS). AWS earned an operating profit of $9bn. That’s the beauty of high margin business that contributes only 12% revenues but 63% of operating profits.
- Amazon does not offer enough granularity in its financial statement to see how segments other than AWS are doing individually. The only thing that we know is that Amazon is losing money in its internationally-focused online stores (-$1.7bn in 2019).
- Non-AWS business from North America’s online and physical stores is slightly profitable, earning $7bn in 2019, which is a 4% operating margin. But if we compare the North America segment with last year, we can see a decrease from 7.3bn to 7bn. Amazon’s growth in revenue in this segment was not enough to cover the increase in operating expenses, even though fulfillment expenses did not grow so quickly as before.
- Amazon’s net income after taxes was in 2019 $11.6bn, which is a 15% increase. That translates to a $23.01 profit per share.
- Amazon’s business model is no longer about selling stuff online. Amazon pivoted to become a provider of e-commerce infrastructure for other businesses. Amazon collects fees from other companies for using its services like fulfillment and delivery. But the main thing they are willing to pay for is, obviously, access to hundreds of millions of Amazon’s customers.
Amazon’s Income Statement in Table Format
| 2017 | 2018 | 2019 | Δ | %Δ | |
|---|---|---|---|---|---|
| Online stores | 108.4 | 123.0 | 141.2 | +18.3 | +15% |
| Physical stores | 5.8 | 17.2 | 17.2 | 0.0 | 0% |
| Third-party seller services | 31.9 | 42.7 | 53.8 | +11.0 | +26% |
| Subscription services | 9.7 | 14.2 | 19.2 | +5.0 | +36% |
| AWS | 17.5 | 25.7 | 35.0 | +9.4 | +37% |
| Other | 4.7 | 10.1 | 14.1 | +4.0 | +39% |
| Revenue | 177.9 | 232.9 | 280.5 | +47.6 | +20% |
| Cost of revenue | -111.9 | -139.2 | -165.5 | -26.4 | +19% |
| Gross Profit | 65.9 | 93.7 | 115.0 | +21.3 | +23% |
| Technology and content | -22.6 | -28.8 | -35.9 | -7.1 | +25% |
| Fulfillment | -25.2 | -34.0 | -40.2 | -6.2 | +18% |
| Marketing | -10.1 | -13.8 | -18.9 | -5.1 | +37% |
| General and administrative | -3.7 | -4.3 | -5.2 | -0.9 | +20% |
| Other expenses | -0.2 | -0.3 | -0.2 | +0.1 | -32% |
| Operating income | 4.1 | 12.4 | 14.5 | +2.1 | +17% |
| Other income (net) | -0.3 | -1.2 | -0.6 | +0.6 | -51% |
| Income before taxes | 3.8 | 11.3 | 14.0 | +2.7 | +24% |
| Income taxes | -0.8 | -1.2 | -2.4 | -1.2 | +98% |
| Other net income | -0.0 | 0.0 | -0.0 | 0.0 | -256% |
| Net income | 3.0 | 10.1 | 11.6 | +1.5 | +15% |
How Much Cash Amazon Earned and How Amazon Spent it (Cash Flow Statement Overview)
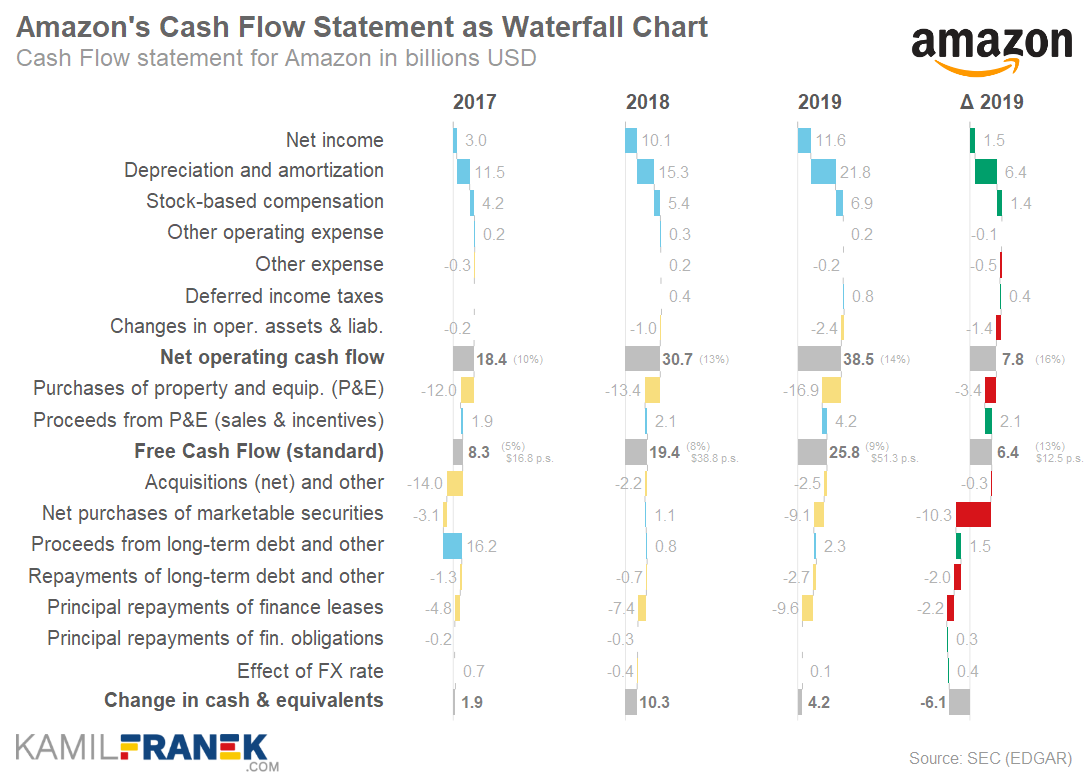
- Amazon was not a very profitable company in 2019. But if we look at the cash it generates, it is quite a different story. Amazon’s operating cash flow was $38.5bn, which is a growth of 25%.
- Even with sizable operating cash flow, Amazon invests nearly all the cash back into the company. Its capital expenditures are massive, but it is not easy to see it from Amazon’s cash flow statement directly. A large part of Amazon’s capital expenditures is financed by leases. Leases are treated differently in the cash flow statement and, therefore, are a source of confusion.
- The standard Amazon’s capital expenditures that you can find in its cash flow statement are $12bn. However, this number quite misrepresents the real scale of Amazon’s capital expenditures because it ignores investment financed by leases. If we included capital expenditures financed by leases, we would get nearly triple the reported amount.
- Real capital expenditures are far more massive than shown in the cash flow statement. It means that the Free Cash Flow that Amazon discloses in its financials is far smaller in reality. I did the math on this, and Amazon’s free cash flow is not $26bn but only $5.5bn, and it was stuck at single digits levels for years. If we adjusted it for stock-based compensation, it would turn negative.
- Amazon’s capital investments are mainly about adding additional capacity to fulfillment operations and also for AWS data centers.
- Amazon’s low free cash flow is not a bad thing. It is just a result of Amazon’s aggressive investments even after 25+ years in business.
- Since Amazon invests nearly every dollar earned back into the company, it is no surprise that it does not pay any dividend and does even buyback its own shares, as many other tech giants massively do. It simply does not have any cash left after its investments.
- Amazon, compared to other tech giants, never spent a large amount on acquisitions. Amazon acquires mainly smaller companies, and its cash it spends each year on acquisitions is usually in low billions. The only exception was the $13.7bn acquisition of Whole Food in 2017.
Amazon’s Cash Flow Statement in Table Format
| 2017 | 2018 | 2019 | Δ | %Δ | |
|---|---|---|---|---|---|
| Net income | 3.0 | 10.1 | 11.6 | +1.5 | +15% |
| Depreciation and amortization | 11.5 | 15.3 | 21.8 | +6.4 | +42% |
| Stock-based compensation | 4.2 | 5.4 | 6.9 | +1.4 | +27% |
| Other operating expense | 0.2 | 0.3 | 0.2 | -0.1 | -40% |
| Other expense | -0.3 | 0.2 | -0.2 | -0.5 | -214% |
| Deferred income taxes | -0.0 | 0.4 | 0.8 | +0.4 | +80% |
| Changes in oper. assets & liab. | -0.2 | -1.0 | -2.4 | -1.4 | +134% |
| Net operating cash flow | 18.4 | 30.7 | 38.5 | +7.8 | +25% |
| Purchases of property and equip. (P&E) | -12.0 | -13.4 | -16.9 | -3.4 | +26% |
| Proceeds from P&E (sales & incentives) | 1.9 | 2.1 | 4.2 | +2.1 | +98% |
| Free Cash Flow (standard) | 8.3 | 19.4 | 25.8 | +6.4 | +33% |
| Acquisitions (net) and other | -14.0 | -2.2 | -2.5 | -0.3 | +13% |
| Net purchases of marketable securities | -3.1 | 1.1 | -9.1 | -10.3 | -901% |
| Net investing cash flow | -27.1 | -12.4 | -24.3 | -11.9 | +96% |
| Proceeds from long-term debt and other | 16.2 | 0.8 | 2.3 | +1.5 | +196% |
| Repayments of long-term debt and other | -1.3 | -0.7 | -2.7 | -2.0 | +302% |
| Principal repayments of finance leases | -4.8 | -7.4 | -9.6 | -2.2 | +29% |
| Principal repayments of fin. obligations | -0.2 | -0.3 | -0.0 | +0.3 | -92% |
| Common stock repurchased | - | - | - | ||
| Common stock cash dividends paid | - | - | - | ||
| Other (net) | - | - | - | ||
| Net financing cash flow | 9.9 | -7.7 | -10.1 | -2.4 | +31% |
| Effect of FX rate | 0.7 | -0.4 | 0.1 | +0.4 | -120% |
| Change in cash & equivalents | 1.9 | 10.3 | 4.2 | -6.1 | -59% |
How Amazon’s Balance Sheet Changed? (Balances Sheet Overview)
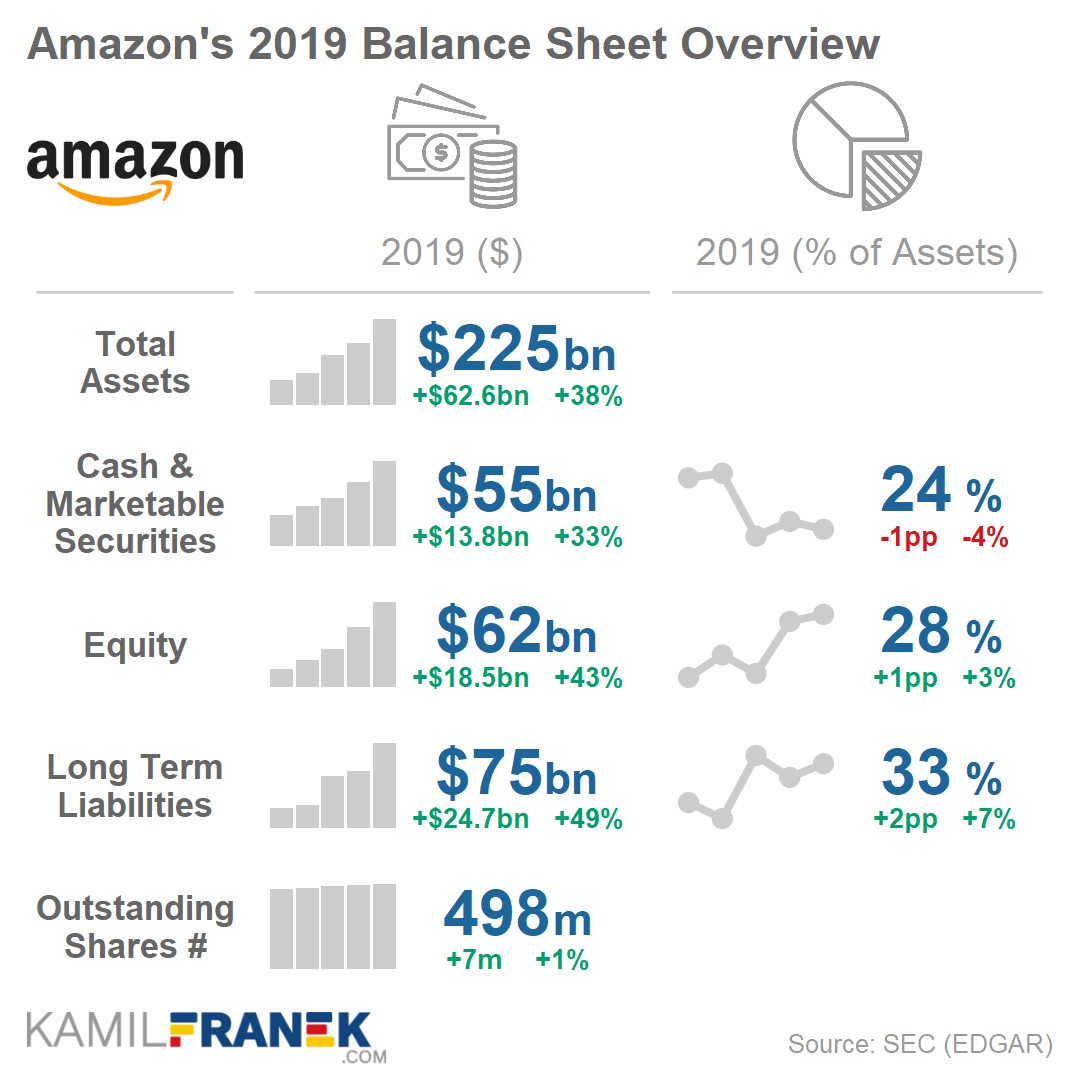
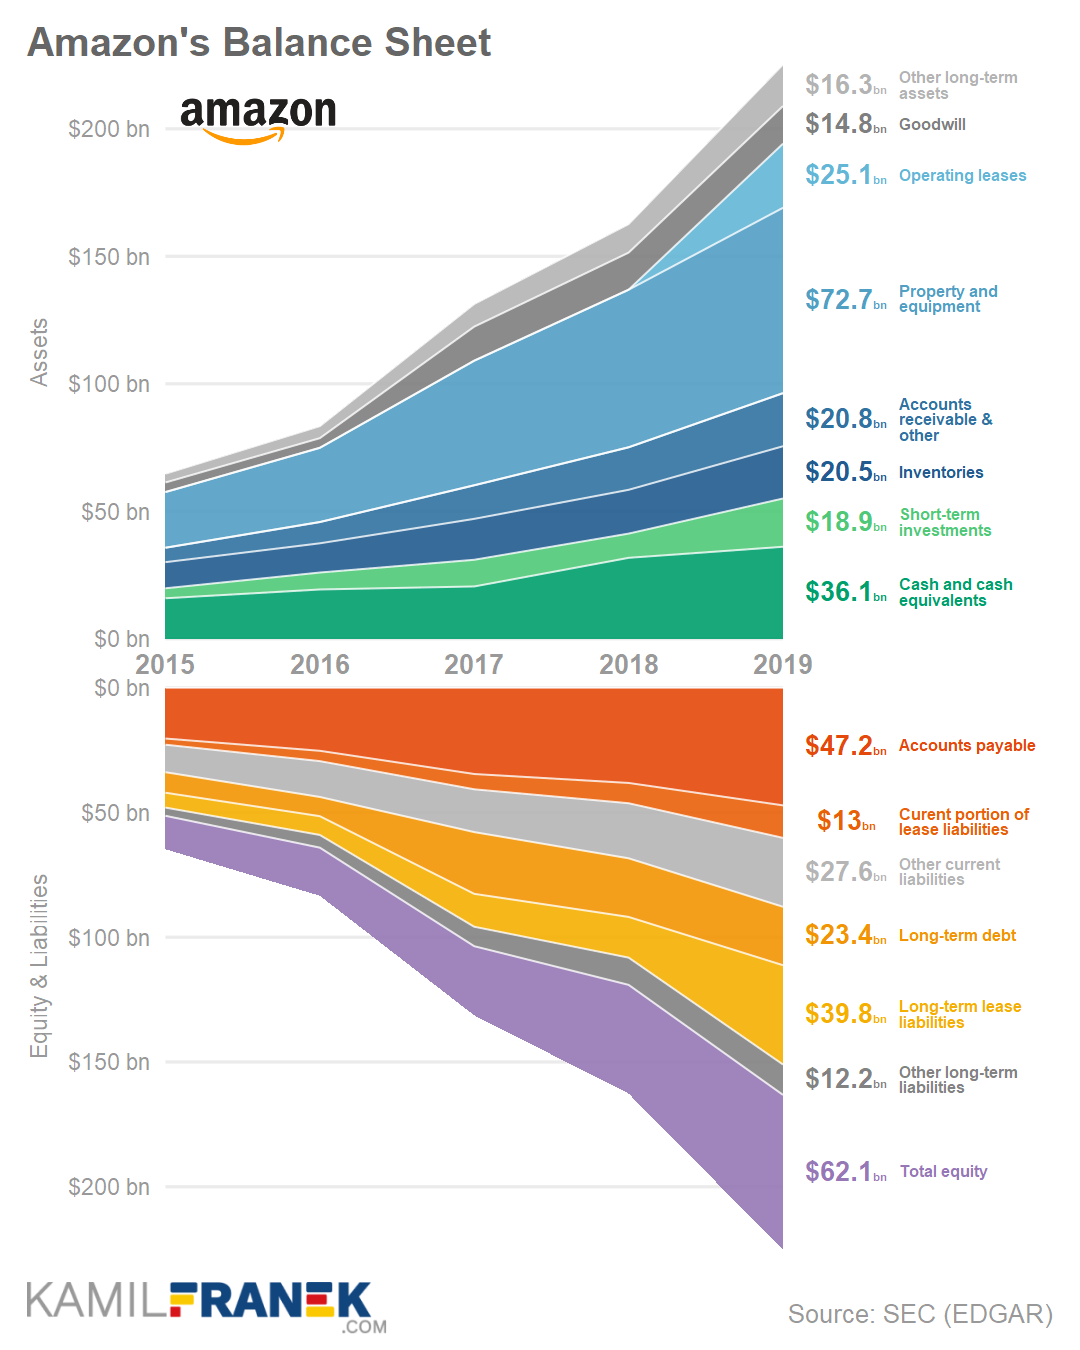
- Amazon’s assets jumped up in 2019 by $63bn to $225bn. (+38% growth). However, the biggest piece of this jump ($25bn) was caused by US GAAP changes that require companies to show also assets and obligations from operating leases as part of the balance sheet. Unlike with other changes, companies were not required to restate the previous period. Therefore, this change distorts the comparison of changes between 2019 and 2018, both in assets and liabilities.
- Other significant changes that drive asset increase were growth in property and equipment and short-term investments.
- On the balance sheet equity&liabilities side, the main driver of the increase, apart from the leasing accounting change described earlier, was an increase in equity that was mostly driven by current year profit and also increased capital thanks to stock-based compensation.
Amazon’s Balance Sheet in Table Format
| 2017 | 2018 | 2019 | Δ | %Δ | |
|---|---|---|---|---|---|
| Cash and cash equivalents | 20.5 | 31.8 | 36.1 | +4.3 | +14% |
| Short-term investments | 10.5 | 9.5 | 18.9 | +9.4 | +99% |
| Inventories | 16.0 | 17.2 | 20.5 | +3.3 | +19% |
| Accounts receivable & other | 13.2 | 16.7 | 20.8 | +4.1 | +25% |
| Other current assets | 0.0 | 0.0 | 0.0 | 0.0 | |
| Property and equipment | 48.9 | 61.8 | 72.7 | +10.9 | +18% |
| Operating leases | - | - | 25.1 | ||
| Goodwill | 13.3 | 14.5 | 14.8 | +0.2 | +1% |
| Other long-term assets | 8.9 | 11.2 | 16.3 | +5.1 | +46% |
| Total assets | 131.3 | 162.6 | 225.2 | +62.6 | +38% |
| Accounts payable | 34.6 | 38.2 | 47.2 | +9.0 | +24% |
| Curent portion of lease liabilities | 6.1 | 8.1 | 13.0 | +4.9 | +60% |
| Other current liabilities | 17.1 | 22.1 | 27.6 | +5.5 | +25% |
| Long-term debt | 24.7 | 23.5 | 23.4 | -0.1 | 0% |
| Long-term lease liabilities | 13.2 | 16.3 | 39.8 | +23.5 | +144% |
| Other long-term liabilities | 7.8 | 10.9 | 12.2 | +1.2 | +11% |
| Total equity | 27.7 | 43.5 | 62.1 | +18.5 | +43% |
| Total liabilities and equity | 131.3 | 162.6 | 225.2 | +62.6 | +38% |
The data source for the above visuals, graphs, and tables is Amazon’s annual report (K-10), and other documents that Amazon provided to investors. You can find them on Amazon’s investor relation website.
🔵 Breakdown & Analysis of Amazon’s Revenue (Income Statement)
Amazon’s revenue in 2019 grew by 20% to $281bn. That is very healthy growth for a company founded more than 25 years ago and reflects Amazon’s high level of cash reinvestment.
Let’s look into Amazon’s revenue breakdown in much more detail. Can we break Amazon’s revenue down into individual revenue streams? How did revenue develop thorough the last five years? And what is driving its growth?
Amazon’s annual report offers four different ways of how to split its revenues:
- We can split it based on Amazon’s operating segments into:
- North America Segment
- International Segment
- AWS (Amazon Web Services)
- Another way how to view Amazon’s revenue is by geography.
- However, most granular is split into product & services groups:
- Online stores
- Physical stores
- Third-party seller services
- Subscription services
- AWS
- Other (mostly advertising)
- There is also Product and services split as part of the income statement. But it does not bring much more additional insights. It is just a more high-level grouping of the previous product & services groups split.
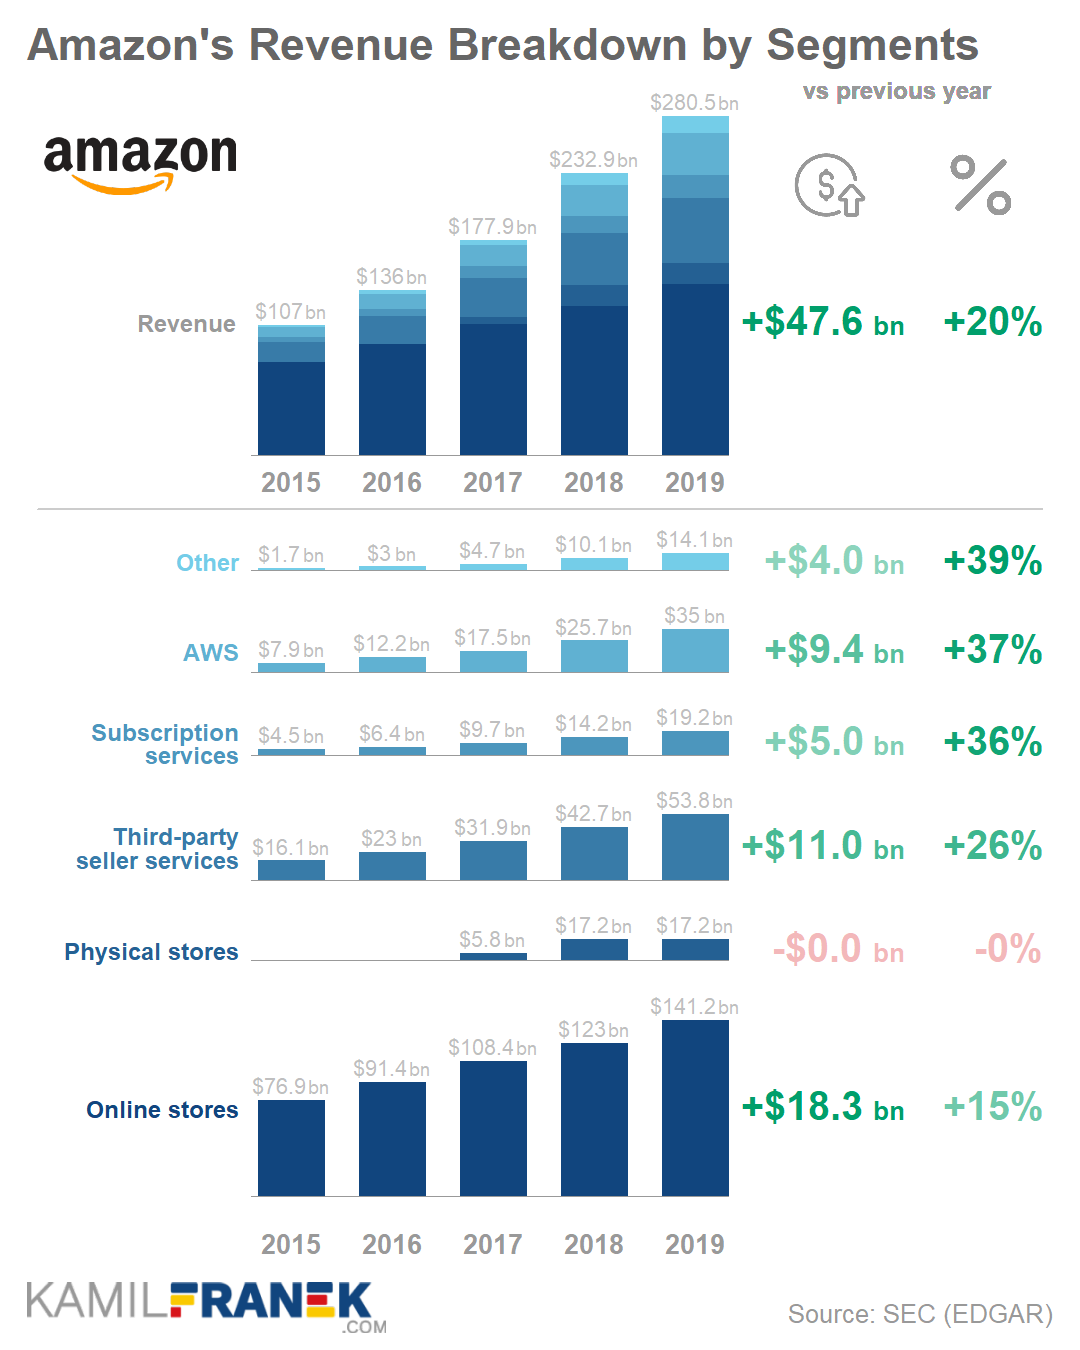
The chart below offers a detailed look at Amazon’s revenue broken down based on product & services groups. It is the most detailed split of revenue Amazon discloses, and it will be the primary one I will use.
The graph offers a look at both total revenue and also individual revenue streams for the last five years. On the right, you can also find a difference to the previous year in $ and also as a % growth.
So what does the chart above tell us about Amazon’s revenue? The first thing we can see is what are the primary revenue sources.
Three main revenue sources that make up over 80% of total revenue are:
- Online store - revenue from direct sales by Amazon ($141bn a year)
- Third-party seller services - revenue from fees charged ($54bn)
- AWS - usage-based revenue from Amazon’s Web Services ($35bn)
Of course, high revenue does not equal profitability. Online store operating profit is probably negative, and Amazon’s main sources of profit are therefore AWS and third-party sellers services.
The chart above also shows the biggest drivers of 20% revenue growth (+$48bn) in 2019 vs. 2018. The biggest driver of revenue increase in dollar amount were online stores that added §18bn of revenue. Online stores were followed by third party services (+$11bn) and AWS (+$9bn).
So traditional Amazon’s direct online sales are still a significant revenue contributor growing by 15% in 2019. But the rest of the revenue (except physical stores) is growing far more aggressively (26% to 39% growth). If you also consider the higher profitability of this services-based revenue, it is good news for the future of Amazon’s profitability.
Overall, total revenue growth is slowing down. But looking closer, we see that this is because of the slow down in less profitable parts (online stores & physical stores). The growth of revenue streams with higher profitability is still impressive.
Lets now explore each part of revenue individually.
Amazon’s Online Stores Revenue
![]()
Online Stores revenue represents revenue from online sales of goods & services that Amazon sells directly to its customers. That means the seller of the items is Amazon itself, not a third party seller that uses Amazon.com as a marketplace.
Online stores are currently the biggest revenue stream for Amazon, with $141bn of revenue in 2019. It is also the slowest growing one (+15% in 2019). Because the rest of the revenue is growing at a much higher rate, the online store share of total revenue decreases for some time (50% share in 2019).
However, having a 50% share on revenue does not mean that most goods are still sold directly by Amazon, quite the opposite. When we compare online stores with a 50% share on revenue with a 19% share of third-party seller revenue stream, we have to consider differences in what is counted as revenue.
When Amazon sells goods directly, revenue includes the full value of the product sold. On the other hand, if a third party sells the same product through Amazon, Amazon will recognize as revenue only the fees the third party pays to Amazon for using their platform, which is usually around 15% from the price + fulfillment fees.
Even though third-party sellers’ revenue is far lower than from the online store, third-party sellers represent around 58% of the value of physical goods sold on Amazon.
This fact is also important when looking at Amazon’s 38% market share in US e-commerce. The market share number includes both direct sales by Amazon and also sales of third parties through Amazon.
Amazon’s biggest competitor Walmart recently finally started seeing some results in its e-commerce business investments. Walmart e-commerce market share in the US is only around 6%, but Walmart is far stronger than Amazon in overall (e-commerce + physical) market share.
The main Amazon’s website, driving the most revenue, is amazon.com. But Amazon also has many international websites like amazon.de (Germany) and amazon.co.uk and others. Together they drive the majority of revenue.
Additionally, Amazon owns many other smaller websites, sells its own hardware, and has its own private brands in many different product categories. It is all reflected as part of Online store revenue.
It is also important to realize that Amazon’s online store business, which represents 50% of revenue, is also the one that is probably not even profitable.
Amazon does not disclose the profitability of online stores separately. The online store business’s negative profitability can be deduced from the North America segment’s overall low operating margin (4%). This margin reflects a mix of online stores and also other higher-margin revenue streams.
Suppose we assume that third party seller revenue stream is a business with a positive operating margin. In that case, online stores have to be loss-making to get to the overall 5% operating margin. My estimates point to low single digits negative operating margin for direct online store business.
Independent Sites owned by Amazon
I mentioned earlier that Amazon also owns several e-commerce sites that have its own brand. One of them is zappos.com, Amazon’s wholly-owned subsidiary since 2009, when Amazon acquired it for $1.2 billion.
Originally it was an online shoe seller that later diversified also into clothing. Zappos is famous mainly for its unique, expressive company culture. It was able to stay separate and keep this culture even after the acquisition.
Another example might be the innovative online-pharmacy pillpack.com, which Amazon acquired in 2018. This company might be Amazon’s attempt to revolutionize the U.S healthcare industry. PillPack revenue target for 2020 was reportedly $1 billion, but Amazon probably has much more aggressive plans with it in the future.
Healthcare is one of the areas that Amazons started pushing into recently. It is also working with J.P. Morgan Chase and Berkshire Hathaway on a joint venture called Haven that should improve care and bring down healthcare costs for employees of these companies.
Amazon is also working on applying machine learning to cancer research and on other healthcare-related projects. In 2020 it also launched new hardware called Halo, a health and wellness tracker.
Amazon’s Hardware
Part of Online store revenue is also Amazon’s hardware. Mainly Amazon Echo Dot but also many other Echo variations. It is estimated that Amazon sold around 37 million smart speakers in 2019 and has a 30% market share in this category with Google in second place with a 20% market share.
Amazon disclosed that around 45% of sales made through Alexa devices were third party sales, which is a lower share than the overall average of 58%. Amazon explained that customers use Alexa disproportionately more for household consumables, where Amazon is more competitive than third party sellers.
Another piece of Amazon Hardware are Amazon’s tablets, fire TV, and obviously Kindle e-book reader itself. Amazon also sells other smart devices under its Ring brand like security cameras, alarms, doorbells, and others.
In 2020 Amazons also introduced the Halo health and wellness tracker that was another important reminder that Amazons means its push into the health & wellness market seriously.
Amazon’s Own White Label Brands
It is a common practice among retailers to offer its own private label products, and Amazon is not an exception. It has many own private brands like:
- Amazon Basic (basic accessories)
- Amazon Element (vitamins and baby products)
- Amazon Essential (Clothing)
- Strathwood (Furniture)
- clothing brands like Goodthreads, Daily Ritual, Cable Stitch, 28 Palms, and many other
- Amazon is also having its publishing company amazonpublishing
Amazon’s private labels products became a center of interest from politicians and regulators because of reports of possible misuse of data from third-party sellers by Amazon to create competing products under its private brands.
Initially, the company denied this claim. But in a recent anti-competitive hearing in front of a US House of Representative subcommittee, Amazon’s CEO Jeff Bezos said that the company is currently investigating it internally.
It looks that although Amazon has a policy that forbids the use of third party sellers data to be used in this way, this data are readily available for anyone to use.
It is interesting that although this became such a huge topic, Amazon’s revenue from private label brands is only 1%. That is not a very big share compared to other retailers. Even if we assume that these products are more profitable than others, it is not a very big profit generator.
Amazon’s Physical Stores Revenue
![]()
Physical stores revenue includes primarily revenue of Whole Food stores Amazon acquired in 2017. Physical stores revenue did not grow at all compared to 2018 and stayed at $17bn, representing 6% of Amazon’s total revenue in 2019.
Physical stores are currently a tiny business for Amazon and represent a very small market share compared to other physical retailers. But even though Amazon has a very tiny share of physical retail, the acquisition of Whole Food in 2017 was a very disruptive event.
Not because approximately 500 Whole Food stores would create some significant threat to other retailers. But it was a sign that Amazon is serious about its push into the physical retail business, and buying Whole Food was probably just a first step on this journey.
Whole Food acquisition was not the first Amazon experience with physical stores. The company was experimenting with different offline store concepts since 2015 when it launched the first Amazon Book store. Since then, it has introduced and experimented with many other different concepts like Amazon Go, Amazon 4-star, Amazon Pop-Up stores, and even something as weird as Amazon Treasure Truck.
And we should not also forget about a couple of physical PillPack.com pharmacies. PillPack is an online pharmacy that Amazon acquired.
These different Amazon store concepts (without Whole Foods) represent just around 50 stores, mostly Amazon Go and Amazon Books. Together they generate negligible revenue. However, these stores were an important testing ground for Amazon, where they can test different approaches and get a lot of data about both customer online and offline behavior.
The latest addition to different stores was the first Amazon Fresh store launched in 2020, which was another step in Amazon’s learning process.
This store features Amazon Dash Cart technology, which eliminates one of the most frustrating things in physical stores, and that is waiting in a check-out line. (This is a different technology than used in Amazon Go stores). These stores are also far bigger than previous concepts.
When evaluating Amazon’s potential in physical retail, it is not only about growing more prominent physical presence. It as also about synergies between the physical and online world. Amazon’s physical stores are also bases for Amazon grocery delivery (Amazon Fresh) that the company is trying to ramp up.
Another interesting business that came out of Amazon’s retail store experimentation is offering Amazon state of the art check-out technology for other businesses to use. You can check out this offer on www.justwalkout.com.
I have already mentioned that Amazon has pivoted from being an online retailer to being a technology provider for online retail. There is a similar opportunity in the physical world. And since physical retail is a brutal business, being the provider of infrastructure can, in the end, be more profitable than the retail business itself.
Amazon’s Third-party Seller Services Revenue
![]()
Amazon offers third-party seller services to other businesses that can sell their products on Amazon.com next to other goods sold directly by Amazon.
Currently, around 58% of goods sold by on Amazon’s sites are sold by third-party sellers. This percentage is similar for many product categories. The only exception is the books category, where third parties sell only around 26% of books.
Third-party seller services generated $54bn of revenue in 2019, which was a 26% growth. It is the second biggest revenue stream bringing 19% of Amazon’s total revenue. It is estimated to be far more profitable than Amazon’s direct e-commerce business.
Revenue consists of fees that Amazon is charging to third-party sellers. This fee is typically around 15% from the product price plus additional fees if the third party wants Amazon to handle also a fulfillment of the order.
Fulfillment by Amazon means that your product will sit next to Amazon’s inventory in its fulfillment centers and wait there for customer orders. Thanks to that, delivery can be as quick as the delivery of items sold directly by Amazon and can qualify for free Prime delivery.
Here is a short video by Amazon that summarized what services it offers for sellers.
Amazon also offers other services like the ability to auction for the top position in product searches, which work similarly to Google’s search engine.
Amazon’s third-party seller business became the center of the controversy when WSJ’s report suggested that Amazon uses non-public data about third-party products for its benefit. Amazon picked a successful third-party product and then designed and offered a similar product under its private label brand.
One former Amazon employee called it “candy shop, everyone can have access to anything they want.”
The company first denied this but later, Jeff Bezos announced that Amazon is unsure if that happened and is investigating it internally.
This conflict of interests of Amazon as a marketplace provider and as the main seller on Amazon platform was one of the main points of a recent hearing before the Subcommittee on Antitrust, Commercial, and Administrative Law in the US House of Representatives. You can see highlights of the Amazon-related part of hearing in the video below.
It was evident that it was “hearing” only by name. Many members did not seem even to want Jeff Bezos to answer their questions fully, since it meant they would have less screen time for themselves.
This hearing was mostly a political theater, and Jeff Bezos did not have any space to explain anything in detail. Despite all of that, it was a good summary of most of Amazon’s antitrust issues.
Third-party seller services are also the cornerstone of what Amazon offers in India, where regulation does not allow Amazon to sell goods directly. Therefore Amazon’s business there is mainly about providing the marketplace and charging fees for this service. However, it has some minority ownership in several third-party sellers selling on www.amazon.in marketplace.
Amazon is very interested in India and is investing heavily in this market. But Amazon was also interested in China, and it did not help either. Amazon recently exited its marketplace business after 15 years-long attempts to break into the Chinese market. Success is not guaranteed even for a company like Amazon.
Competition in India is also incredibly challenging. Amazon’s problems are not only big players like Amazon’s main competitors in India, Flipkart, which is owned by Walmart. The biggest competition are traditional, small, usually family-owned vendors. These small retailers control around 90% of the market, and even local corporations have a really hard time to compete with them.
Another issue in India is the really strong political power that local small retailers have. Amazon won’t have it easy. But the company is not holding back there and even started piloting food delivery and also online pharmacy (Against strong opposition from India’s chemist & druggist organization)
Amazon’s Subscription Services Revenue
![]()
Amazon’s subscription services revenue grew by 36% to $19bn in 2019. This revenue stream includes different subscription services, but the vast majority of revenue comes from 150 million Prime members worldwide. Estimated 112 millions of members are situated in the US with subscription price $119 per year.
Amazon Prime membership includes many freebies. The most relevant one is free and fast delivery and also content-rich video streaming service Prime Video.
Amazon Prime membership turned out to be one of the most successful experiments Amazon did. On the one hand, free shipping motivates people to maximize the value from its $119 a year fee and, as a result, shop more often and spend much more money per order on Amazon.
On the other hand, Prime Video is a great acquisition channel since it is a worthwhile alternative to Netflix on its own. And if you subscribe to Prime for this video content, why not to utilize its free shipping option too?
Prime video is a crucial part of Prime membership. Amazon is investing heavily in its content by licensing content and recently also by investing billions of dollars in creating its own movies and shows through its own Amazon Studios.
Prime membership also includes many other services like Prime Music, Prime Gaming, and Prime Reading. Amazon offers its members also many discounts and special deals both online and in Amazon’s physical stores, including Whole Food.
Although Prime membership is a core part of Amazon’s subscription services revenue, we cannot forget about many other services outside Prime membership that are part of subscription revenue. That includes services like Kindle Unlimited (access to e-books), Amazon Audible (audiobooks), Amazon Music Unlimited (music streaming), and also Amazon Channels, which will allow you to purchase selected premium TV channels for a monthly fee.
Amazon’s Web Services (AWS) Revenue
![]()
Amazon’s Web Services (AWS) is the world’s most widely used cloud platform where businesses can rent raw server power or higher level cloud services without a need to build their own infrastructure. AWS earned $35bn of revenue in 2019 (+37% growth), and thanks to its high 26% margin, it is the biggest profit-making segment for Amazon.
Sometimes people find it weird that Amazon is in this business, but it is not hard to understand that. Thanks to Amazon’s size and specific needs, no other provider could offer this service at that time. They had to build their own data centers to support their own e-commerce business and even develop its own services that did not exist before.
The decision to offer access to Amazon’s IT infrastructure to other businesses was a crucial decision for the company. It was, for a long time, the only profitable business for Amazon. Amazon was able to use those profits and invest it in its fulfillment network and other non-AWS investments.
There are many voices nowadays suggesting that it makes business sense to spin-off AWS from Amazon, but I am not one of them.
The spin-off would probably mean higher cost for Amazon because it would still need to run its own infrastructure and develop a lot of in-house solutions but would lose the option to monetize it through AWS and amortize its investments better.
Without AWS, Amazon would not be so far ahead of its retail competition as it is now.
On the other hand, the spin-off would mean better potential to win business from many of Amazon’s current competitors that are cautious about using AWS when Amazon competes with them in other areas. For example, Walmart actively discourages its suppliers from using AWS.
However, there is an even more important reason against the AWS spin-off. Amazon is still in a phase where it invests all of its available cash back into the company. Therefore, AWS spin-off would mean that it would have to slow down these investments that are possible thanks to the transfer of cash from AWS to other parts of Amazon.
My view is that currently, the AWS spin-off would hurt Amazon, and I think that for Amazon’s shareholders, it makes sense to wait until the non-AWS part of Amazon generate enough cash to cover its own investment needs.
On the other hand, for regulators and the US government that complain about Amazon’s power, the AWS spin-off might be a way how to limit Amazon and slow down its growth. But it would have to happen soon.
Other Revenue
![]()
Amazon’s other revenue category consists mainly of advertising revenue. It was the fastest-growing part of revenue in 2019, growing by 39% to $14bn. Advertising includes revenue from display and video ads on Amazon’s sites, and also video ads from various Amazons add supported streaming services like IMDB TV or Twitch.
Amazon has become the third-largest player in online advertising after Google and Facebook, and there is a big potential for further growth. Some reports confirm that more than 50% of product searches online are initiated on Amazon sites and not on Google.
Currently, Prime Video, Amazon’s main video streaming platform, does not show ads within its content, but figuring out how to put advertising into video content is one of Amazon’s immense growth potentials.
Amazon has control over hardware (Kindle TV, Echo), streaming service (Prime Video, IMDB TV, ..), and also e-commerce platform (Amazon.com).
All of these products and services are connected through the same Amazon account. This end to end control gives Amazon a great opportunity to develop end to end “advertising to purchase” journey that is fare more integrated, trackable, and much easier for customers that see the advertising to purchase the product.
This type of advertising is another “disrupting” innovation that Amazon can bring to the ad industry. It might work well not only for video content but also for gaming.
Other notable Amazons product and services
One interesting service that is present withing Amazon infrastructure but does not generate significant revenue is Amazon Pay. Amazon uses it as its own payment service for payments on its sites. But similarly to PayPal, it can also be used by other businesses to collect payment online on their own sites. Compared to PayPal, however, Amazon Pay has a tiny market share.
Amazon is also the owner of sites like imdb.com, a movie and TV show catalog with ratings and reviews. Amazon also owns Goodreads.com, which is a similar catalog and rating site for books. Both services were not developed by Amazon but were acquired after they become successful.
The most recent and bold is project Kuiper, Amazon’s mega project, to launch over 3000 low-orbit satellites to provide internet access around the globe. Kuiper is similar to “Starlink” by SpaceX, a company owned by Elon Musk.
Kuiper is an infrastructure project that makes sense as a part of AWS and its internet of things (IoT) infrastructure. But in time, this project might also widen the pool of people who have access to the internet, which might also benefit the Amazon retail business by merely having a bigger customer pool.
If Amazon ties internet access somehow to its Prime membership, this might have even more potential, but this also has a good chance to be treated as uncompetitive behavior.
One of Jeff Bezos comments about project Kuiper was that Kuiper would be a profitable business for Amazon, and because Amazon got big, they need to do bigger things to move the needle significantly.
However, there are also risks. One of them is that it is currently not clear how much money this project will eventually cost and there are also question about its feasibility.
Also, there is a risk that the Kuiper project might be a way how Jeff Bezos can use Amazon to prop-up Blue Origin. Blue Origin is a separate company owned directly by Jeff Bezos and not Amazon. Amazon must be transparent in selecting a company that will get these satellites to orbit because of the apparent conflict of interest that Jeff Bezos has here.
Overall, it is good news that there will be a service that competes with Starlink by SpaceX, which is building a similar satellite infrastructure.
Alternative Breakdowns of Amazon’s Revenues
The previous part offered a lot of details about individual revenue streams. Let’s zoom out again and look at revenue from different angles to see the main trends.
Overall, Amazon’s revenue is growing strongly by +20%. But not all revenue streams are growing at the same pace. Online stores and also physical stores are significant revenue streams that are growing at a slower rate. In 2019 online store channel grew by 15%.
Then, all the other revenue streams (except physical stores) are growing far more quickly for the last couple of years.
This lower growth of online store revenue means that its share of the total revenue decreases even though absolute revenue from online stores is still growing. I expect this trend to continue. Especially revenue stream “other,” which includes mainly advertising revenue, will be the one to watch out for. In a couple of years, advertising will probably be big enough that Amazon will be forced to report it separately.
This dichotomy between slower-growing direct sales business (physical & online store) and other services also means that slow down in Amazon’s revenue growth in time does not have to be bad news for company profits. Part of the business that will drag revenue growth down is not very profitable anyway.
Another way how to look at revenue is to split it by geography. The geography split clearly shows that Amazon, although it has such massive worldwide recognition, is predominantly earning revenue from the US, and the share of US revenue is increasing in time. The only other region with an increasing share is the “Rest of world” category, which also includes India, a country Amazon is significantly investing in after it exited the marketplace part of its business in China.
Amazon’s business is not as easily exportable as for other technology companies since it is not just about online services running in the cloud but also about its logistic infrastructure on the ground.
Finally, let me offer you alternative visualization of how different Amazon’s revenue sources or product lines are growing. The chart below visualizes:
- How big are various revenue sources compared to each other (visualized by the size of the circle)? The most significant pieces are Online stores with $141bn of revenue)
- How are different income streams growing in absolute revenue compared to the previous year? (more up is the bubble, the biggest revenue increase it represents)
- How are different income streams growing relatively (in %) compared to the previous year? The fastest-growing revenue sources are positioned on the right and the slowest ones on the left.
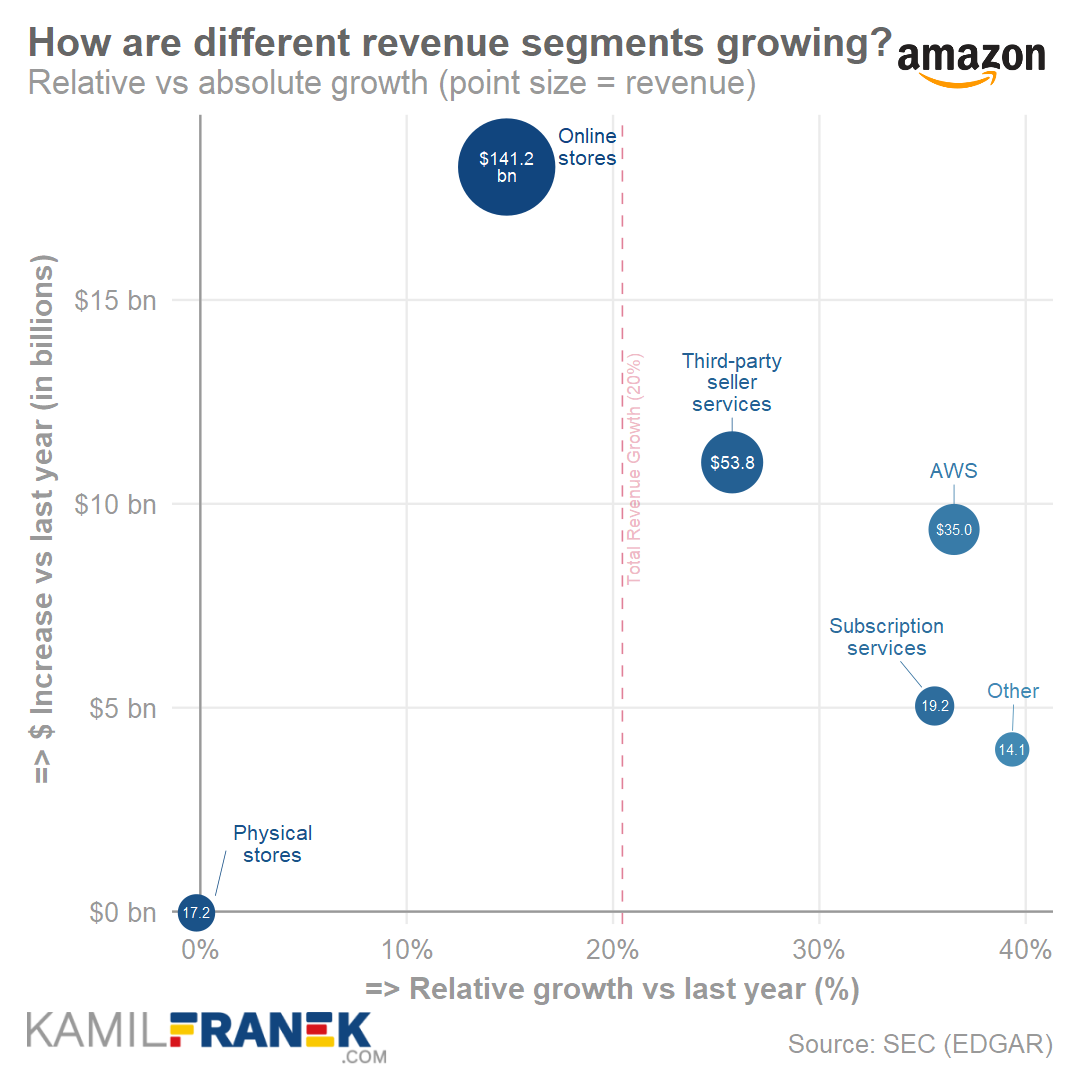
Above, we can see that the Online store channel is the biggest revenue stream and, together with physical stores, grew by slower percentage growth in 2019 than other revenue streams that you can see on the right. But thanks to its size, the online store channel was still the biggest contributor to absolute revenue growth.
🔴 Breakdown & Analysis of Amazon’s Expenses (Income Statement)
Breaking down Amazon’s cost and expenses to see how much and where is company spending is much harder than breaking down revenue. There is far less detail available in Amazon’s annual report about expenses, but it is generally true for most companies out there, not only Amazon.
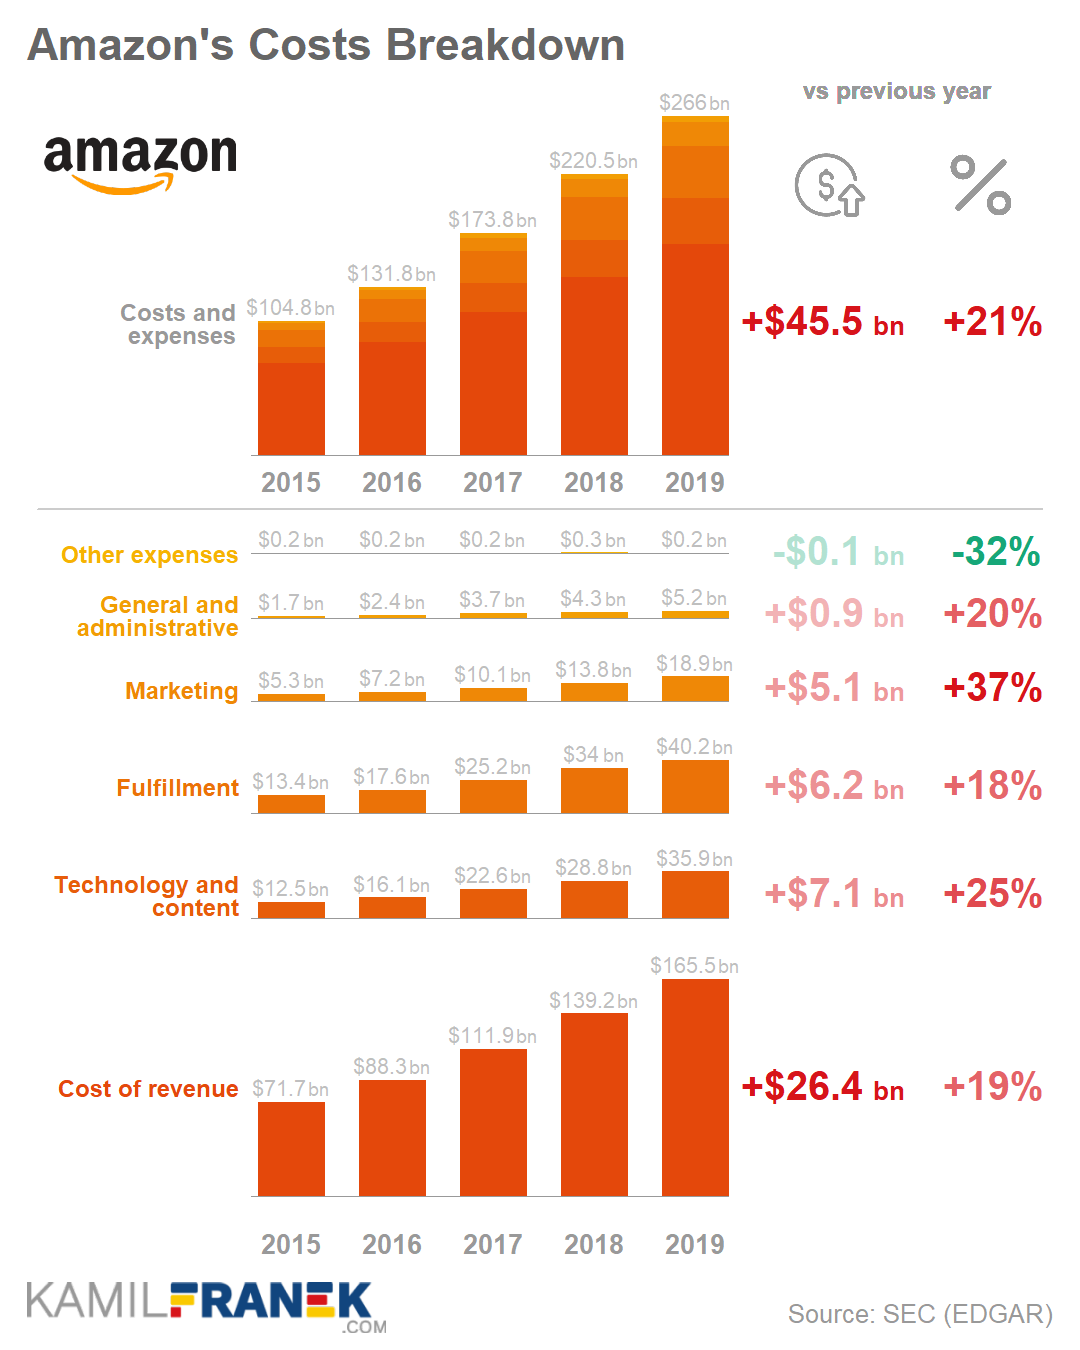
Amazon expenses grew by 21% to $266bn in 2019, which is slightly higher than a 20% growth in revenue. Expenses grew across many categories, and the overall operating margin stayed at 5%. The biggest increase was in marketing expenses, which grew by 37%.
The chart below shows the breakdown of expenses by category and how they changed over time. Overall high expense growth reflects that Amazon is still in a high growth phase, which is reflected both in high expense growth and high revenue growth.
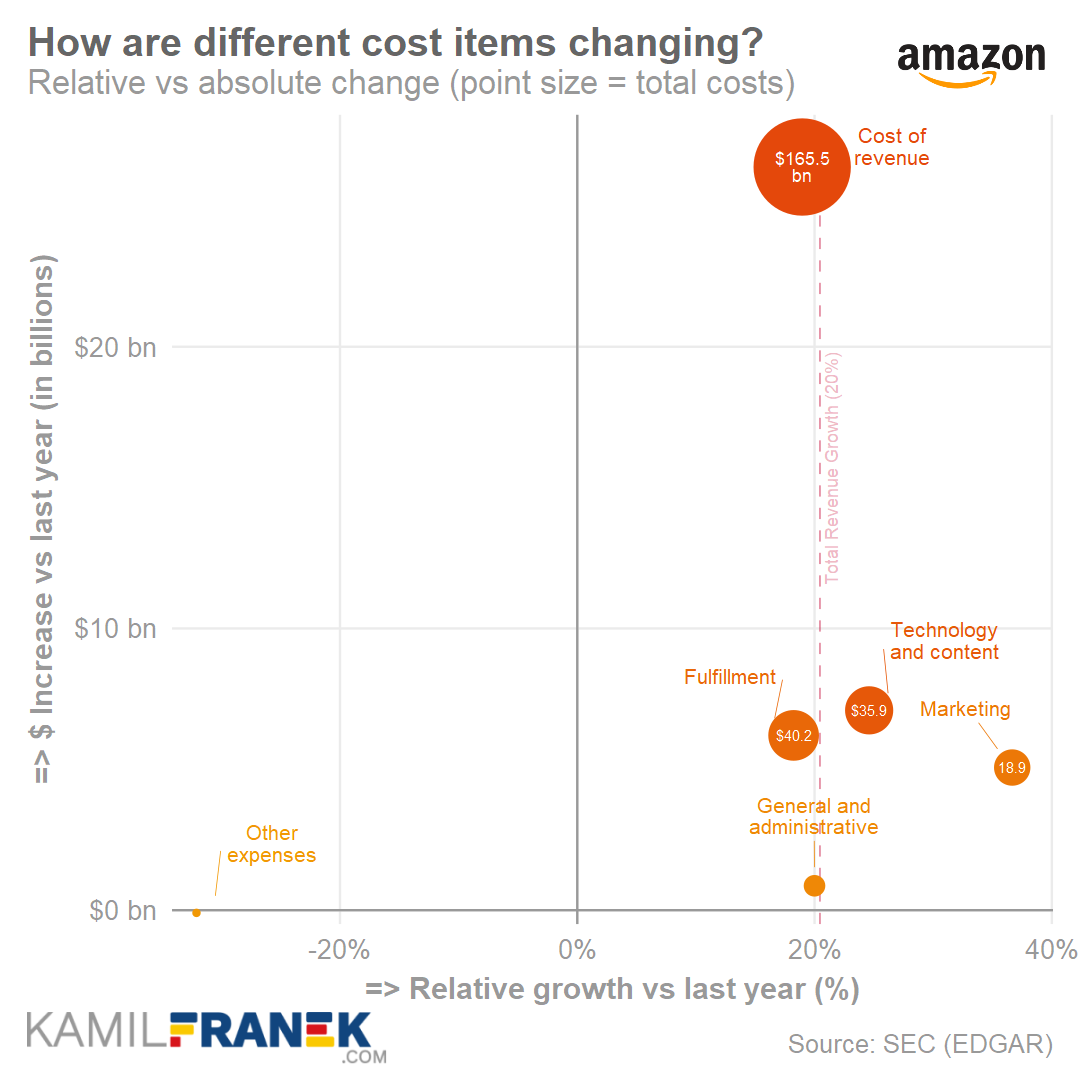
The following chart visualizes how expenses changed across different categories. It shows both relative change from left to right and absolute change from bottom to top.
Cost of revenue
![]()
Amazon’s cost of revenue grew by 19% in 2019 to the total amount of $166bn. Costs of revenue primarily represent the purchase of consumer products that Amazon is selling, shipping costs, and also costs of media content that it mainly offers through Prime video.
Shipping costs are part of “cost of revenue” and in 2019 were $38bn. Amazon expects shipping costs to continue to grow. The company is now pushing for one-day delivery in many locations instead of the previous two-day delivery standard, which means more investment in fulfillment centers, distribution centers, and its own delivery network.
Recently Amazon stopped relying solely on its delivery partners like FedEx, UPC, and USPS and quickly build its own transportation network between its many fulfillment and distribution centers. Amazon runs its own Air deliveries through Amazon Air, which currently operates around 80 planes.
Amazon is also focusing on expanding its last-mile delivery. It launched a delivery service partner program and even financially motivated its employees to become delivery contractors for the company.
Amazon currently has around 60 000 trucks, truck trailers, and vans and ordered another 100 000 electric vans from Rivina. Since it will take Rivian until 2022 to deliver first 10 000 vans, Amazon ordered also 1800 electric vans from Mercedes.
Amazon also runs the Flex program, which connects drivers with Amazon similarly to how Uber or Lyft connects drivers with passengers.
The result of all this focus on its own delivery capabilities will be billions of dollars of savings as the company, thanks to its size, can do delivery more cheaply internally and with tighter integration with its fulfillment centers. In time, Amazon will be able to push delivery times even further.
Amazon also prepares for the future thanks to its acquisition of ZOOX, which is a company working on autonomous driving technology, and Amazon is also actively testing its drone delivery services.
Amazingly, Amazon is already the 4th largest delivery company in the US and delivered around half of its packages in 2019.
Fulfillment Expenses
![]()
Amazon’s fulfillment expenses grew by 18% to $40bn in 2019. It was the lowest growing expense item in that year. This cost category includes mainly operating and staffing fulfillment centers, physical stores, and customer service centers. It also includes payment processing costs.
Fulfillment expenses grew “only” by 18% compared to 35% growth in 2018 because the year 2018 included a lot of costs related to fulfillment network expansion. And since the cost was not so heavily influenced by expansion in 2019, growth in fulfillment costs was relatively low.
Amazon’s fulfillment centers are a state of the art facilities. They smartly combine robots, people, and artificial intelligence to make fulfillment as efficient as possible. You can get a peek of how it looks and works inside the fulfillment center in the video below.
In 2018, Amazon decided to embrace a $15 per hour minimum salary, which affected 250 000 employees and another 100 000 seasonal ones. That turned Amazon from a company ostracized for not paying their employees properly to the company where the minimum wage is higher than the retail industry median wage.
Many saw this as the company’s reaction to political pressure, but there is another explanation. Setting a $15 minimum hourly wage can be viewed as smart business decisions that allowed Amazon to get some good PR and create pressure on its retail competitors that are mostly less efficient. Therefore, the wage increase will be more painful for them.
Amazon’s fulfillment centers are very often criticized for the unhealthy and unsafe working environment.
It was interesting to observe how Amazon slowly became the default company for anyone trying to give an example of a company mistreating their employees. Because previously, this place occupied Walmart, Amazon’s retail rival.
Technology and Content Expenses
![]()
Amazon’s technology and content expenses grew by 25% to $36bn. These expenses include mainly payroll and related expenses for employees involved in the research and development of existing and new products and services.
It also includes infrastructure costs like servers, networking equipment, and data center depreciation and amortization.
From 2020, the company will change useful life over which it amortizes server costs to reflect the longer server life that they see in reality. This change will have a positive impact on 2020 expenses.
Marketing
![]()
Marketing was the fast-growing expenses category for Amazon in 2019, growing by 37% to $19bn. This massive increase is primarily thanks to higher spending on marketing channels as well as bigger spend on the payroll for personnel engaged in marketing and selling activities.
Marketing expenses also include sales commission related to AWS.
General and Administrative
![]()
General and Administrative Expenses of Amazon increased by 20% to $5bn in 2019, mainly because of increases in payroll and related expenses.
Other
Amazon also reports separately category “other expenses,” which include tiny amounts of expenses mostly related to the amortization of intangible assets.
Expenses as % of Revenue & Operating Margin Development
The chart below depicts the same expense categories we explored before as % of revenue for the last five years. The main takeaway is the decreasing share of the Cost of Revenue, resulting from a decreasing share of the revenue from online stores where Amazon sells products directly to the customer.
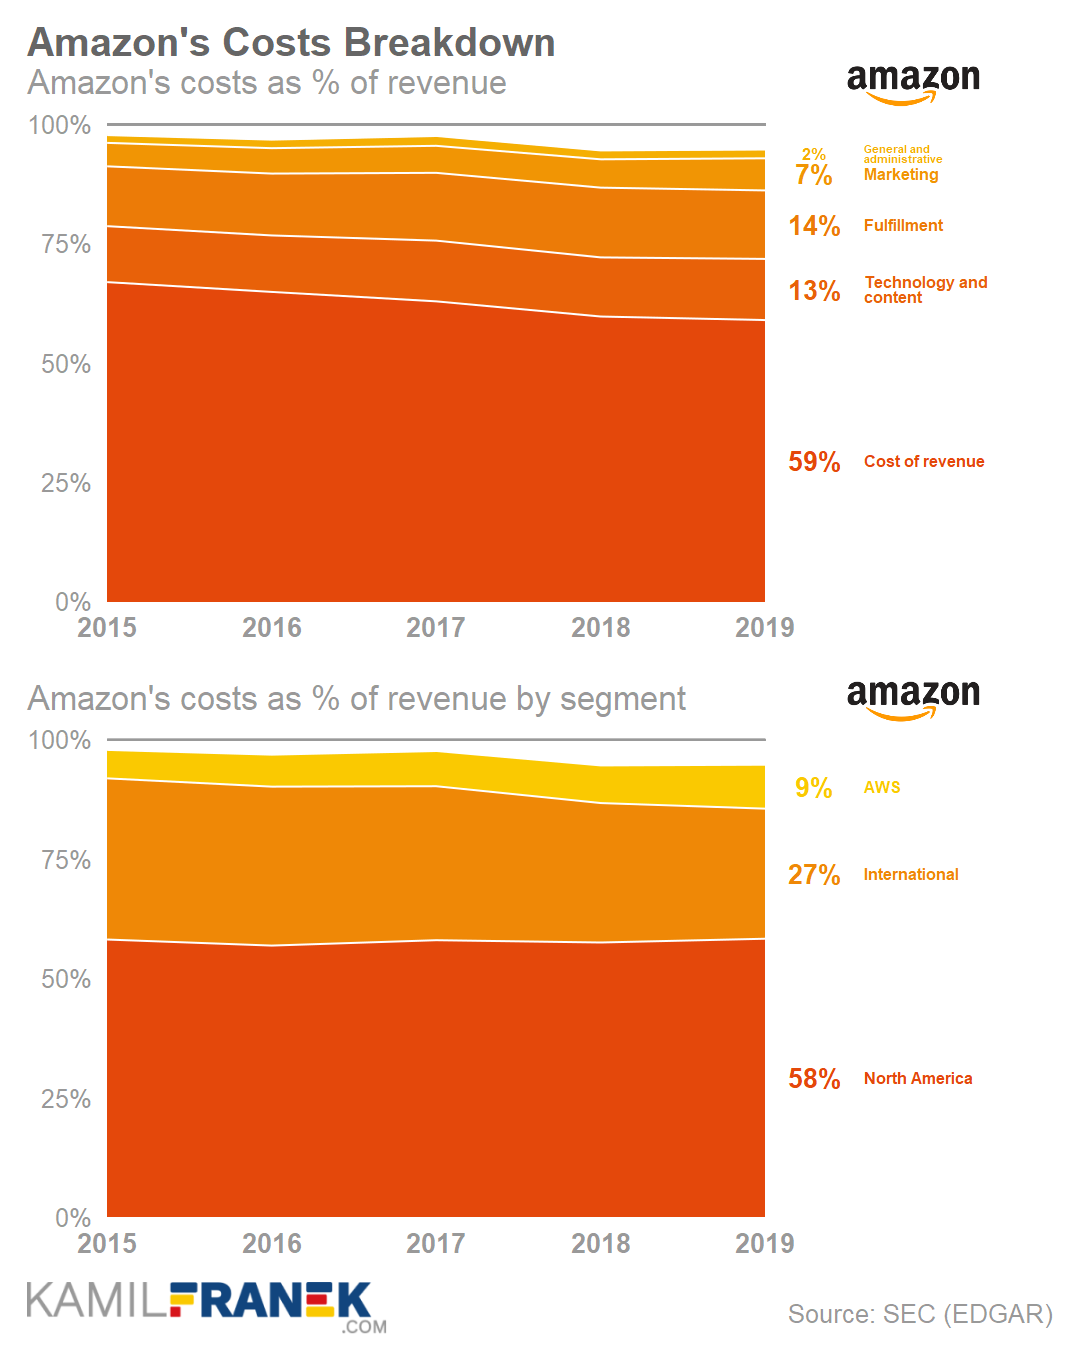
The empty area below 100% line represents the revenue not spend on expenses, which is, in other words, operating margin. Operating margin was 5% of revenue in 2018 and 2019.
The operating margin of 5% is nothing to boast about. Unfortunately, that is a result of Amazon’s core business. Selling stuff online or even offline is not a high margin business.
Amazon also offers a split of operating margin into the AWS segment (26% margin), International segment (-2%), and North American segment (+4%). This split allows us to see AWS result separately but does not allow us to see how profitable Amazon third party business is.
Based on the low operating margin for non-AWS businesses in North America (+4%), we can deduce that company is losing money when it directly sells to customers. A positive 4% operating margin in North America is driven by third-party sellers and advertising business.
💵 Breakdown & Analysis of Amazon’s Cash Flow
Amazon is a company that is still in the high growth phase. For companies that are growing as quickly and investing a lot, the profit and loss statement does not give a good overview of what is happening in the company, and the cash flow statement is far more critical.
Amazon recognizes the importance of cash flow in its annual report and even puts a cash flow statement as a first statement even before the income statement.
“Our financial focus is on long-term, sustainable growth in free cash flows.”
— Amazon’s 2019 Annual Report
Amazon’s even goes one step further and recognizes that standard free cash flow as it is usually calculated is flawed, especially for companies that use a lease financing a lot, and offers two alternative calculations.
Below you can see a visualization of Amazon’s 2019 Cash Flow Statement. It shows how Amazons $39bn of operating cash flow was used. But I have to warn you that although Free Cash Flow in that chart reflects the “standard” calculation you will find in many financial data providers, it does not reflect lease financing. That means that it extremely understates capital investment and overstates free cash flow.
You can see that visualization suggests that after deducting $13 billion of capital investments into property and equipment, the company is left with $26bn of free cash flow. That is not the correct way to look at it.
The problem is that for companies that heavily use leasing to finance their investments, this number can be heavily distorted from reality. Leasing is treated differently from loan financing in the cash flow statement, even though the difference between them is just technical.
Amazon offers several calculations of free cash flows, but none of them reflect all lease financing both by finance and operating leases. Fortunately, I was able to find all the inputs directly in Amazon’s annual report, so it was not so hard to calculate it.
What I did was that I treated operating and finance leases in the same way as if loans funded these investments. The balance sheet already reflects leases this way, so there is no reason the cash flow statement should not. When I added everything up, it turns out that CAPEX in 2019 was not $13bn but $36bn. Quite a difference, isn’t it?
When I reflected this in Free Cash Flow calculation, I arrived at a free cash flow of $5bn in 2019 and 4$bn in 2018. And this is without adjusting for stock-based compensation. That would turn free cash flow to negative territory.
My main point is that although the standardized approach suggests that Amazon has $26bn of free cash flow, the reality is that Amazon does have only around $5bn of free cash at best. It simply invests most of its $39bn of operating cash flow back into the company.
And I don’t see it as a bad thing. It is just a fact that Amazon is still heavily investing in its fulfillment centers and data centers and does not have too much cash left over. That does mean that it does not make sense to do that.
It is also why I think that from Amazon’s point of view, the spin-off of AWS is not in their interest, because AWS, on standalone bases, is generating free cash flow that is used in other parts of Amazon business. Without AWS, this financing source would dry up.
Below you can see a waterfall chart visualization of Amazon’s cash flow statement where you can compare values for the last three years.
⚖️ Breakdown & Analysis of Amazon’s Balance Sheet
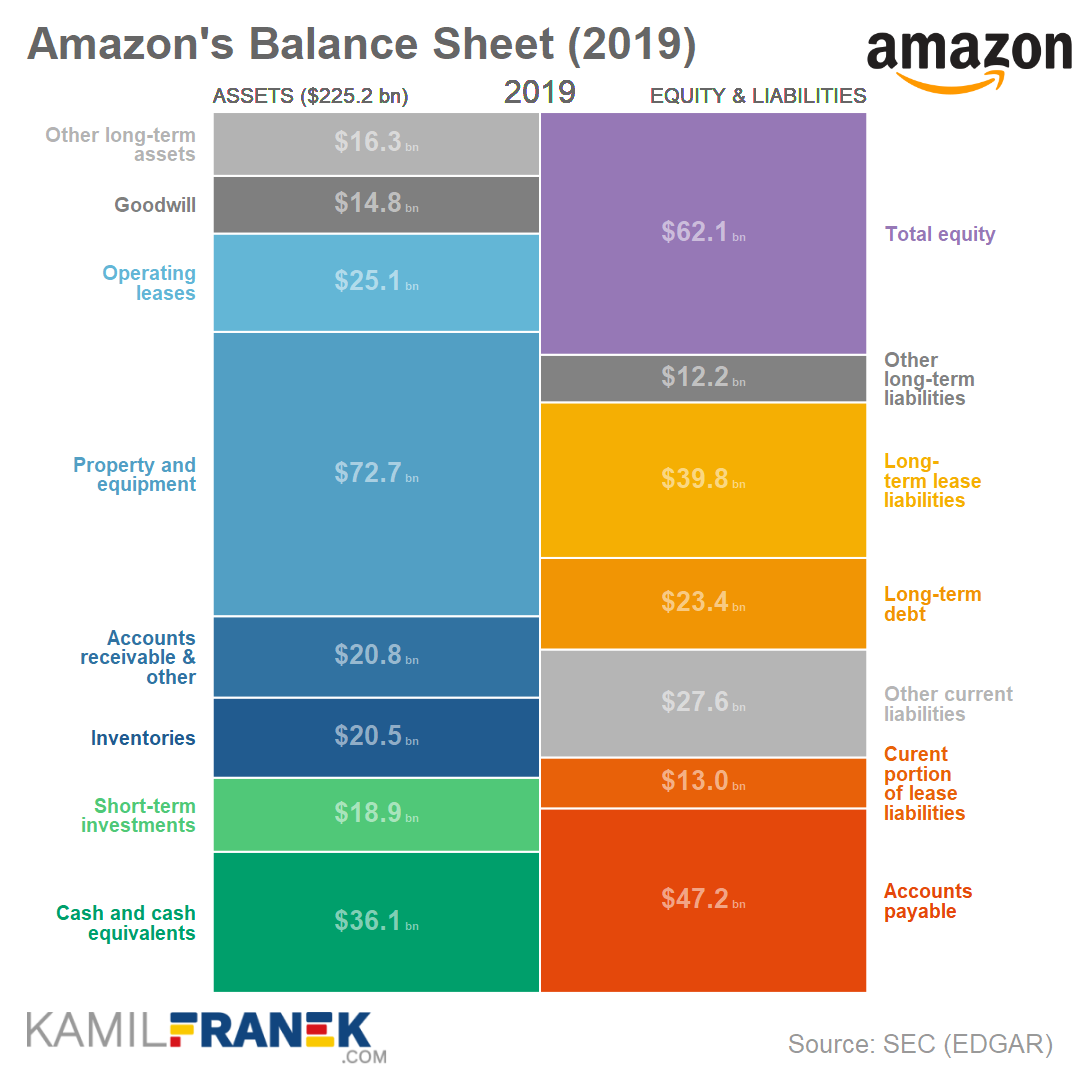
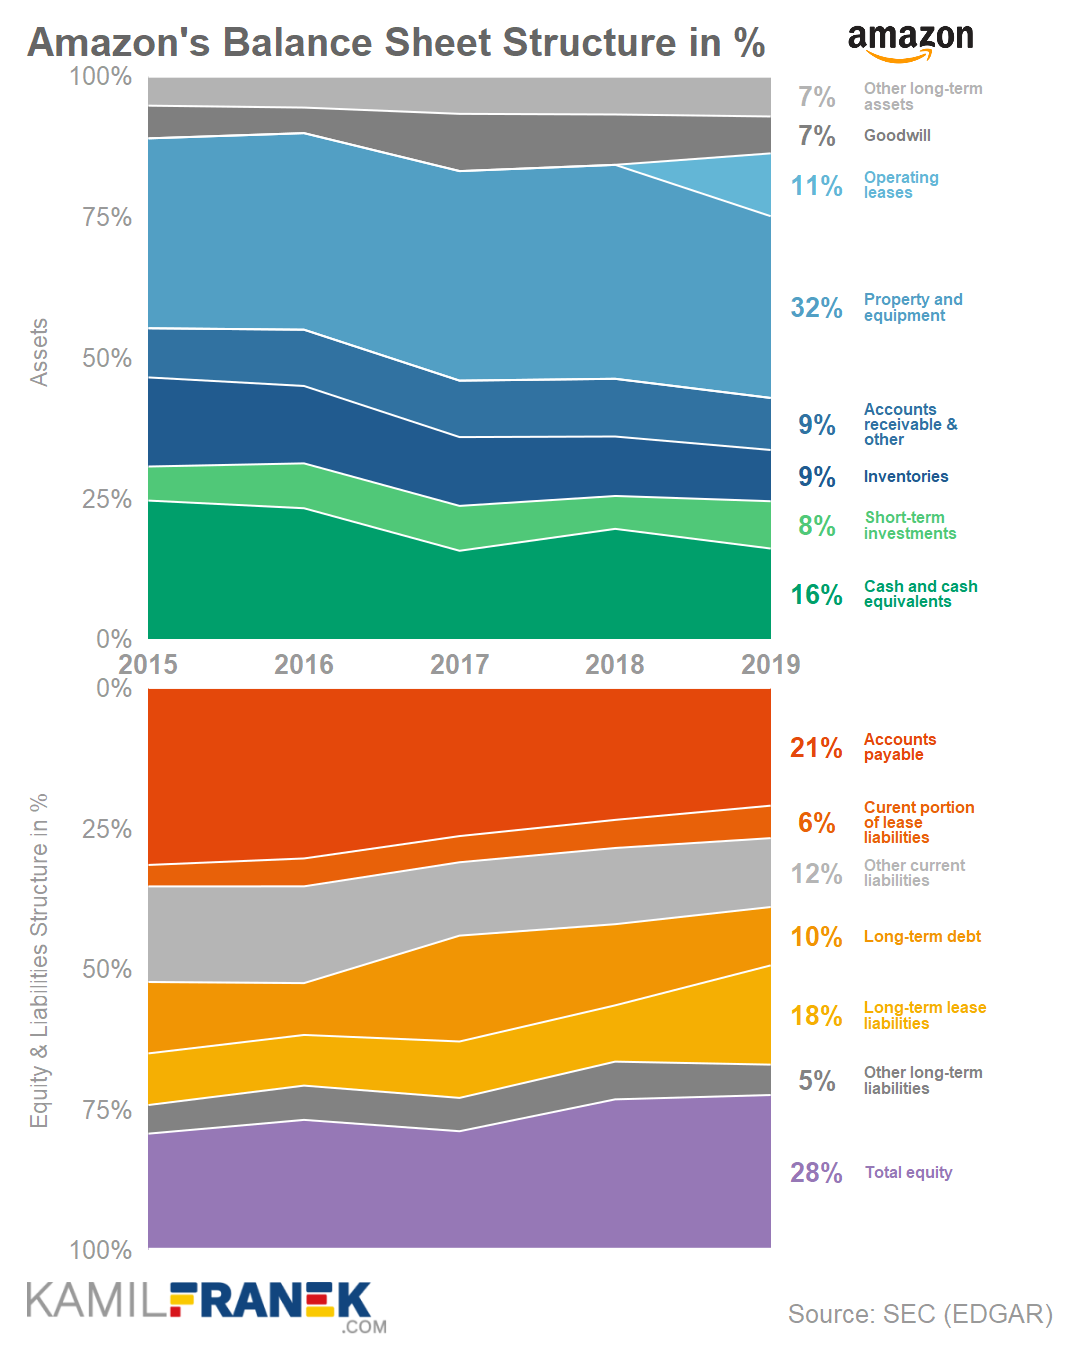
Amazon’s balance sheet jumped massively in 2019 to $225bn. This represented a 38% increase, but although Amazon is still business with a fast-growing balance sheet, some of this 2019 balance sheet growth is just accounting impact from how leases are recognized in balances sheet.
One of Amazon’s outstanding achievements is its ability to efficiently combine software and AI with real physical technology like warehouses, robots, and servers.
We can see this represented in the company balance sheet. Amazon’s assets have a significant proportion of property and equipment, representing its investments in its logistic infrastructure and data centers.
Similar to other technology companies, the balance sheet does not show the value of an intellectual property that the company developed internally. The balance sheet shows only assets that are easy to capture. Therefore we always have to ask ourselves what other assets the company has and how valuable they are when analyzing the company balance sheet.
The chart below shows Amazon’s balance sheet in the US dollar for the last five years. We can see the massive growth of the balance sheet that more than tripled between 2015 and 2019.
But the growth between 2019 and 2018 is boosted by one accounting change as US accounting rules required companies to include long-term operating leases ($25bn) in its balance sheet. On the other side of the balance sheet, we see this jump in Long term lease liabilities.
Unfortunately, companies were not required to restate their previous period financials, and therefore we see a weird jump in 2019 in the total balance sheet.
📚 Resources & Links
Official Annual Reports (K-10)
- Amazon’s Quarterly results documents
- Amazon’s Annual Report 2019 (10-K)
- Amazon’s Annual Report 2018 (10-K)
- Amazon’s Annual Report 2017 (10-K)
Other
- Who Owns Amazon: The Largest Shareholders Overview
- Overview of who owns Amazon.com, Inc. and who controls it. With a list of the largest shareholders and how much is each of their stake worth.
- Jeff Bezos’ 2020 Letter to Shareholders
- Amazon’s Investor Relations Webpage
- Jeff Bezos statement before Subcommittee on Antitrust, Commercial, and Administrative Law (July 29,2020)
- Questions for the Record for Amazon following the July 29, 2020, Hearing of the Subcommittee on Antitrust, Commercial, and Administrative Law
- Amazon’s Press Releases
📝 Technical Notes & Disclaimers
- Accounting approaches how to treat revenues or recognize assets change in time, and companies only offer two or three years of consistent data. I prefer to have at least a five-year history to see medium-term trends. If needed, I attempt to adjust earlier financial statements to make data more consistent in time, using details that the company itself provided. If the company did not disclose enough details, I show the historical years as they were reported.
- Disclaimer: Although I use third party trademarks and logos in this article and its visuals, kamilfranek.com is an independent site. There is no relationship, sponsorship, or endorsement between this site and the owners of those trademarks.