
Facebook Financial Statements: Overview & Analysis 2020
Facebook is a company with a dominant presence in our digital lives. Around 3.3 billion people worldwide used at least one of Facebook’s apps at the end of 2020. Based on Facebook’s financial statements, the company looks like a great business with double-digit growth. But Facebook is also at the center of many privacy issues and other controversies that might hinder its future if not addressed properly.
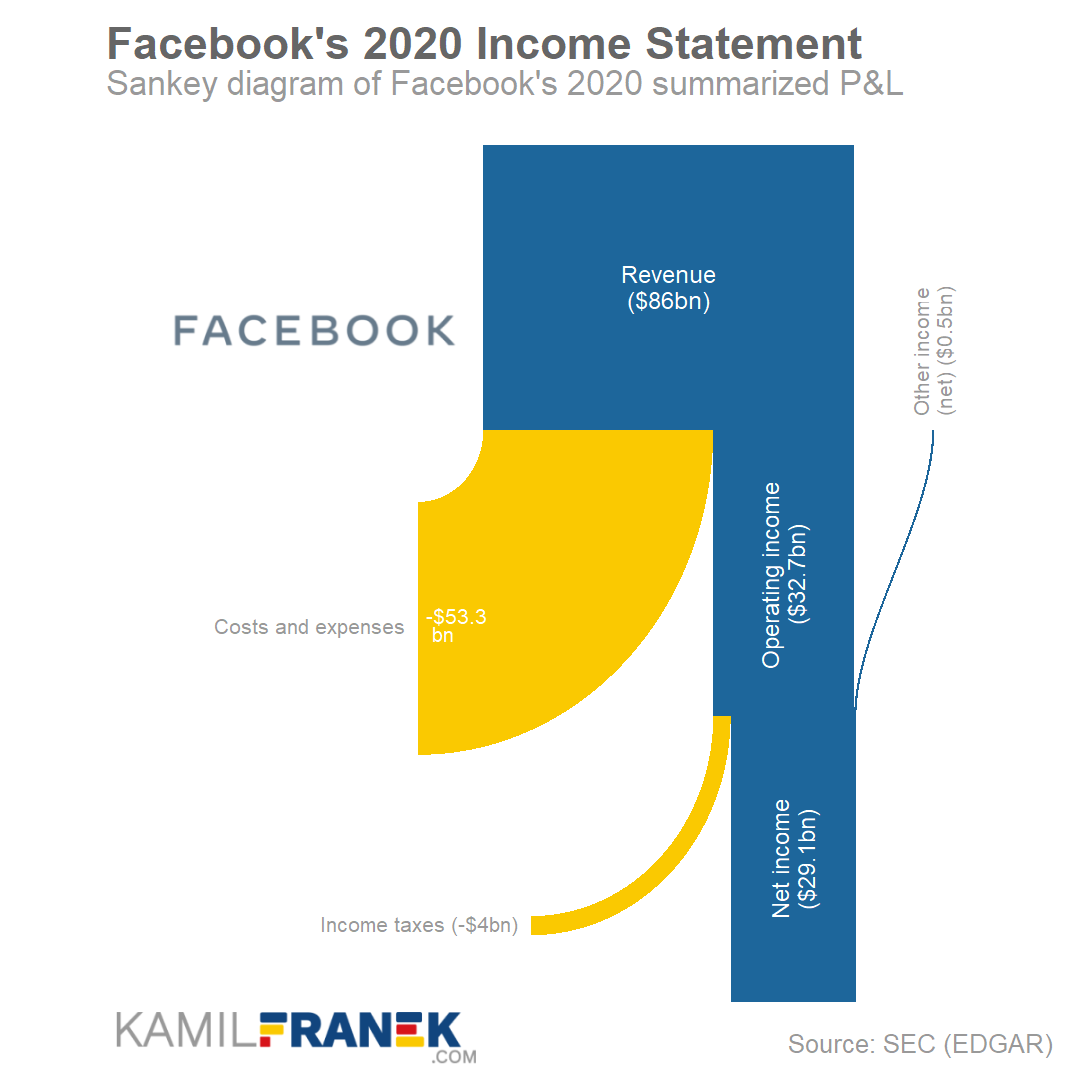
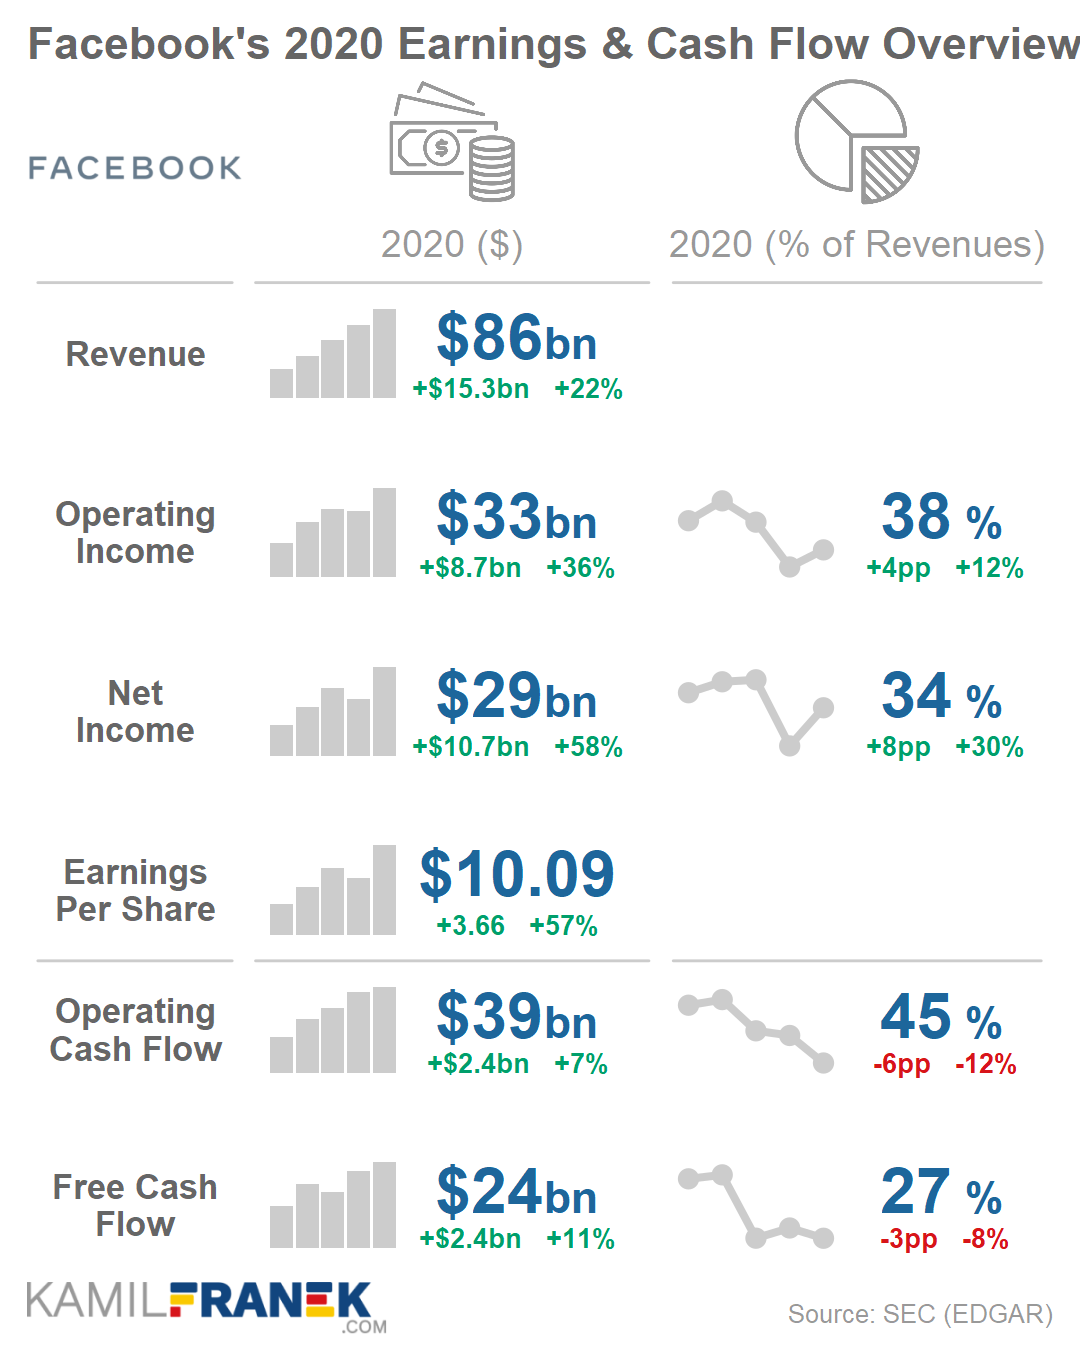
Facebook’s revenue was $86bn in 2020, growing by 22% annually. Facebook also had an impressive 38% operating margin in 2020. This margin will continue to decrease because, despite solid revenue growth, Facebook expenses are growing even faster. Facebook’s annual net income in 2020 was $29bn.
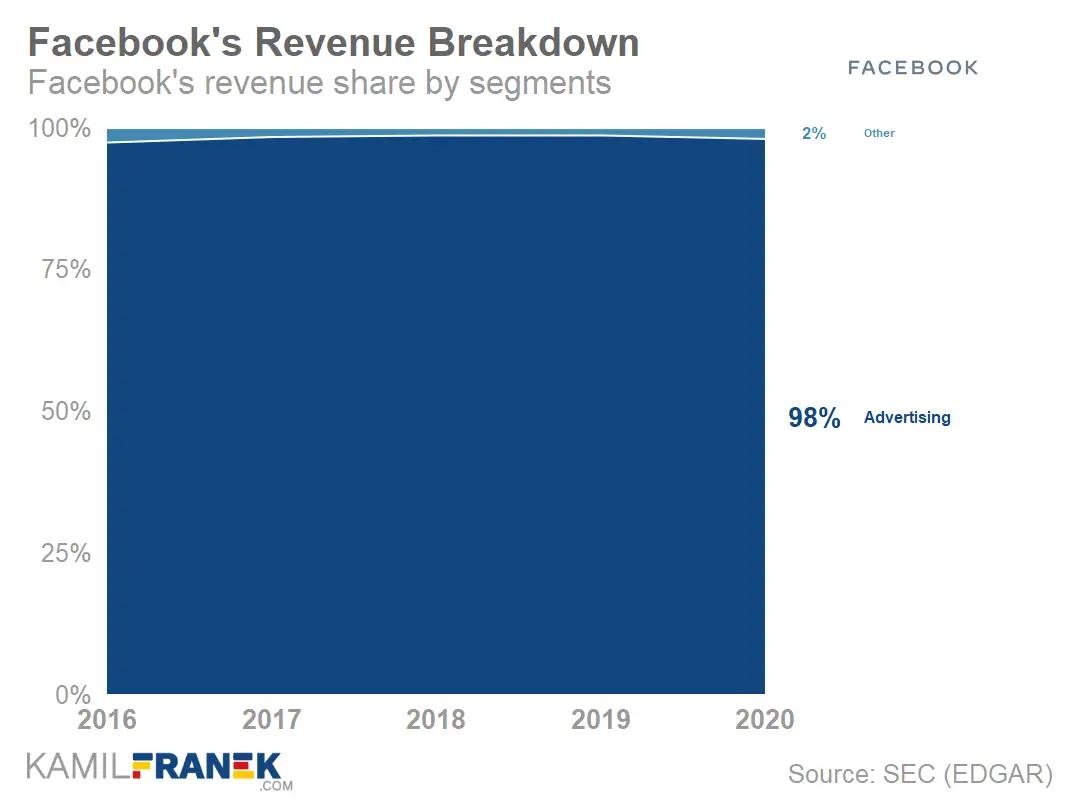
The main way how Facebook makes money is by showing targeted advertising to its 3.3bn users and getting paid for it by advertisers, primarily small businesses. Advertising represents 98% of its revenue.
Like other businesses with advertising-driven business models, Facebook has to juggle both its users’ and advertisers’ interests. An issue arises when both groups’ interests come against each other, for example, when it comes to privacy.
Although Mark Zuckerberg, Facebook’s CEO and controlling shareholder, publicly claims that he wants Facebook to become a privacy leader, Facebook’s actions don’t leave much space for doubt that advertisers’ interests are more important for Facebook. After all, advertisers are the ones paying the bills.
Small businesses will become even more essential for Facebook as it is trying to offer services that will turn Facebook into an e-commerce platform.
Facebook is also a company with a lot of controversy and “toxicity” around it. Some of it is thanks to its past privacy issues and Cambridge Analytica scandal that lead to a $5bn FTC penalty in 2019. But Facebook controversies do not end with privacy issues. Facebook is in the middle of an antitrust lawsuit that questions its acquisition of WhatsApp and Instagram.
We also cannot forget Facebook’s controversies around content moderation, where Facebook is cough in the middle of a fight about the limit of free expression online and where the lines should be drawn. As you can expect, different groups have different ideas about it.
Facebook is not just an innocent bystander here because its algorithms rewarding engagement has helped in the active promotion of more radical political posts and Facebook groups.
Mark Zuckerberg is the person trying to navigate Facebook through these challenging times. Its public image is as controversial as the company itself. He is not only Facebook’s founder and CEO but also a controlling shareholder with a 53% share on voting rights and a 13% share on Facebook’s equity.
Despite all its past and current issues, Facebook’s business is performing exceptionally well. Its users are sticking with it. The number of users is still growing and so are revenue and profits.
Facebook business is tightly focused on its mission of “building communities and connecting people together.” Currently, it does it mainly through its family of social media and messaging apps like Facebook, Messenger, Instagram, and WhatsApp. Facebook is also trying to build a virtual and augmented reality ecosystem that also fits its “connecting” vision very well.
There is much more to say about how Facebook makes money and about its business model. Therefore I wrote a separate article “How Facebook Makes Money: Business Model Explained that goes into more detail about it.
This article will focus mainly on the breakdown of Facebook’s financial statement from its annual report. My aim is to present you the financial numbers simply and visually and tie the numbers to what is happening in the real business behind them.
✈️ Overview of Facebook’s Financial Statements (Summary Charts & Key Takeaways)
Below you will find charts, visualization, and key takeaways for each of Facebook’s financial statements. It is intended to give you an overview of key facts and developments, and I will add more details and background for each financial statement in the following parts of the article.
In case you are new to my posts about companies and specific charts and visualizations that I use, you can check my post “7 Best Charts for Income Statement Presentation & Analysis”. In this post, I explain most of the financial statement visualizations that I use here.
How Much Revenue and Profits Facebook Earned and Where it Came From (Income Statement Overview)
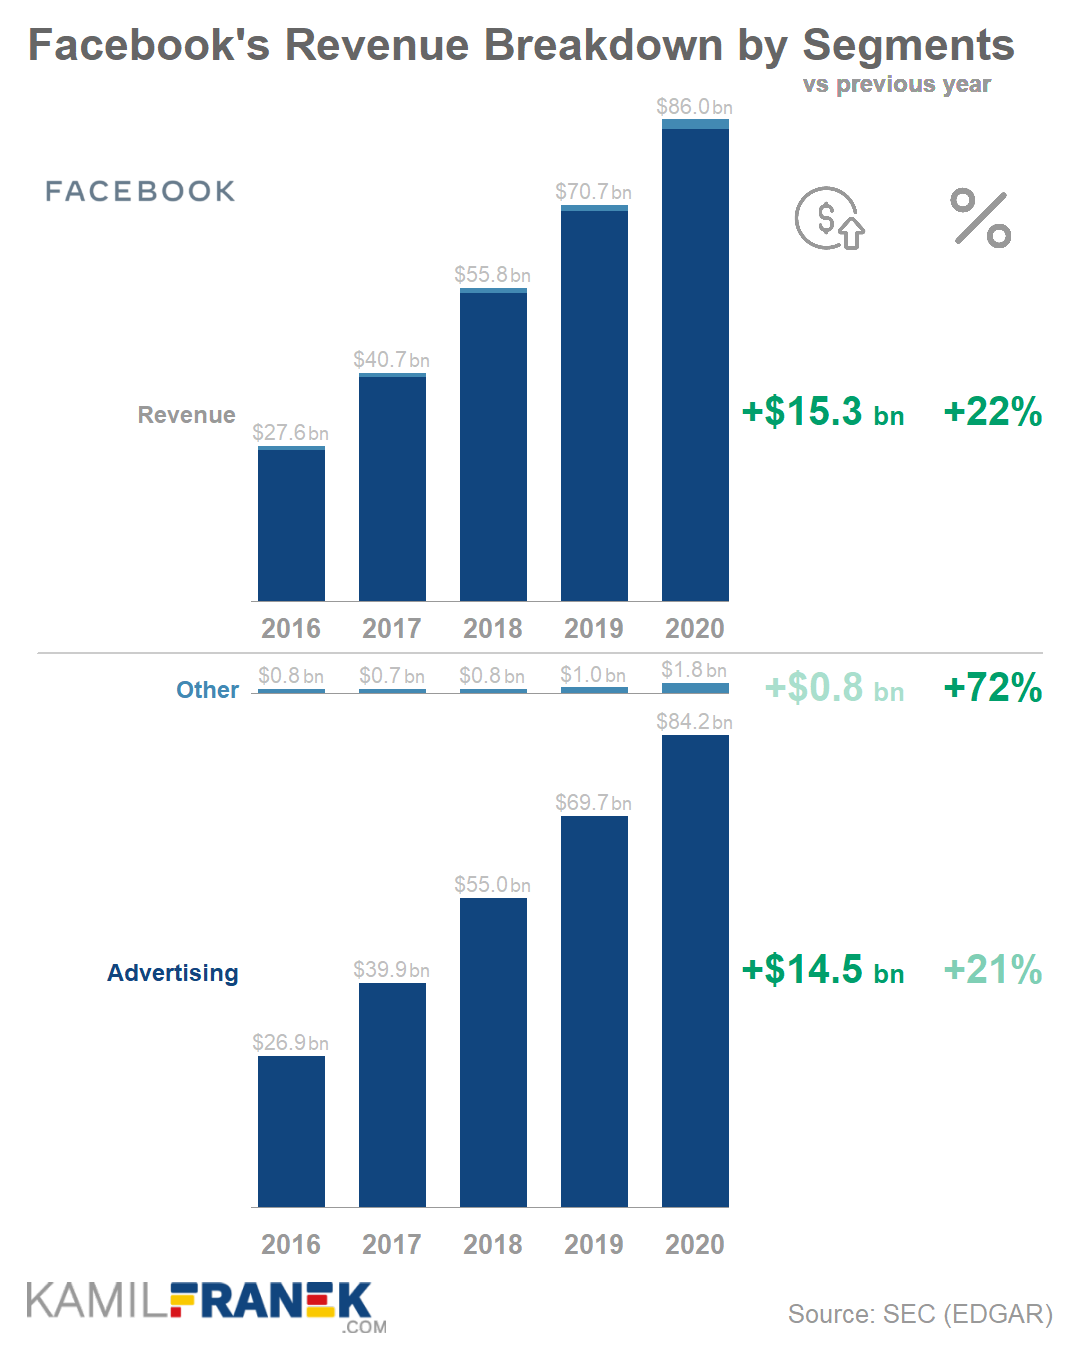
- Facebook’s revenue was $86bn in 2020, growing by 22%. 98% of Facebook’s revenue came from advertising.
- Facebook’s advertising revenue was $84bn in 2020 (+21% growth). This growth was driven by an increase in the number of ads served by Facebook by 33%, partially offset by a 10% decrease in price per ad. The main driver of this price decrease was a decline in demand in Q1 and Q2 because of the COVID-19 pandemic.
- Based on advertisers’ spend data, the biggest advertising revenue generator for Facebook is Facebook Feed with 57% share, followed by Instagram Feed with 16% share and Instagram Stories with 11% share. All Instagram features combined generate approximately 29% of Facebook advertising revenue.
- Instagram advertising revenue is estimated to be $24bn in 2020 and has a 29% share of total advertising revenue. However, compared to 2019, Instagram revenue growth decreased significantly, and its revenue growth in 2020 was similar to the core Facebook app.
- Facebook’s non-advertising revenue was 1.8bn in 2020 and grew by 72%. Most of the non-advertising revenue came from sales of Oculus and Portal hardware and increased by 72%.
- As the largest social media company on the planet, Facebook has a significant market share in the digital advertising market. Its market share in the US was 23%, second to Google with 32%. Amazon, another tech giant, recently became an important digital advertising player too and reached a market share of 8%.
- Facebook had 3.3 billion monthly users at the end of 2020 across all of its products. Facebook is the most significant player by far among social media and messaging tools. COVID-19 pandemic drove more users to Facebook. Its users grew 12% in 2020 compared to 8% growth the year before.
- Despite a lot of heat and toxicity around Facebook in the news, Facebook’s users continue to grow. Even in the US, Facebook monthly users grew by 4% in 2020 compared to 2% in 2019. The fastest-growing region was Asia-Pacific (+15%)
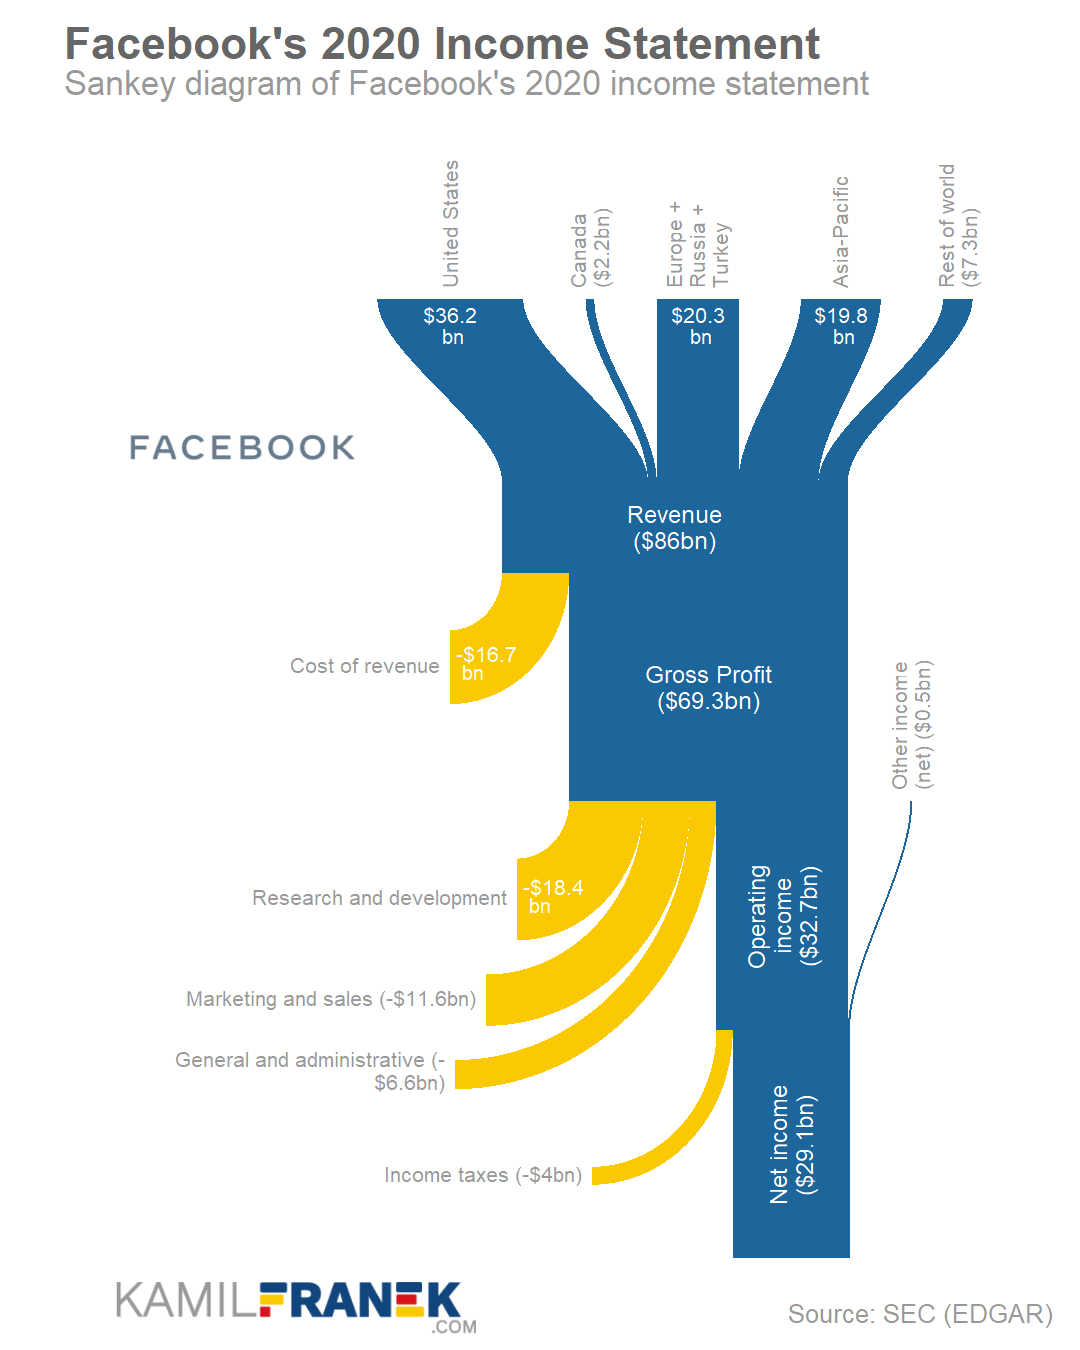
- Geographically, the most significant part of Facebook’s revenue (42%) came from the United States, even though the US share of users is just around 8%. Thanks to much lower revenue per user in the Asia-Pacific region, its share of revenue was just 23%, even though 43% of Facebook users came from the Asia-Pacific region.
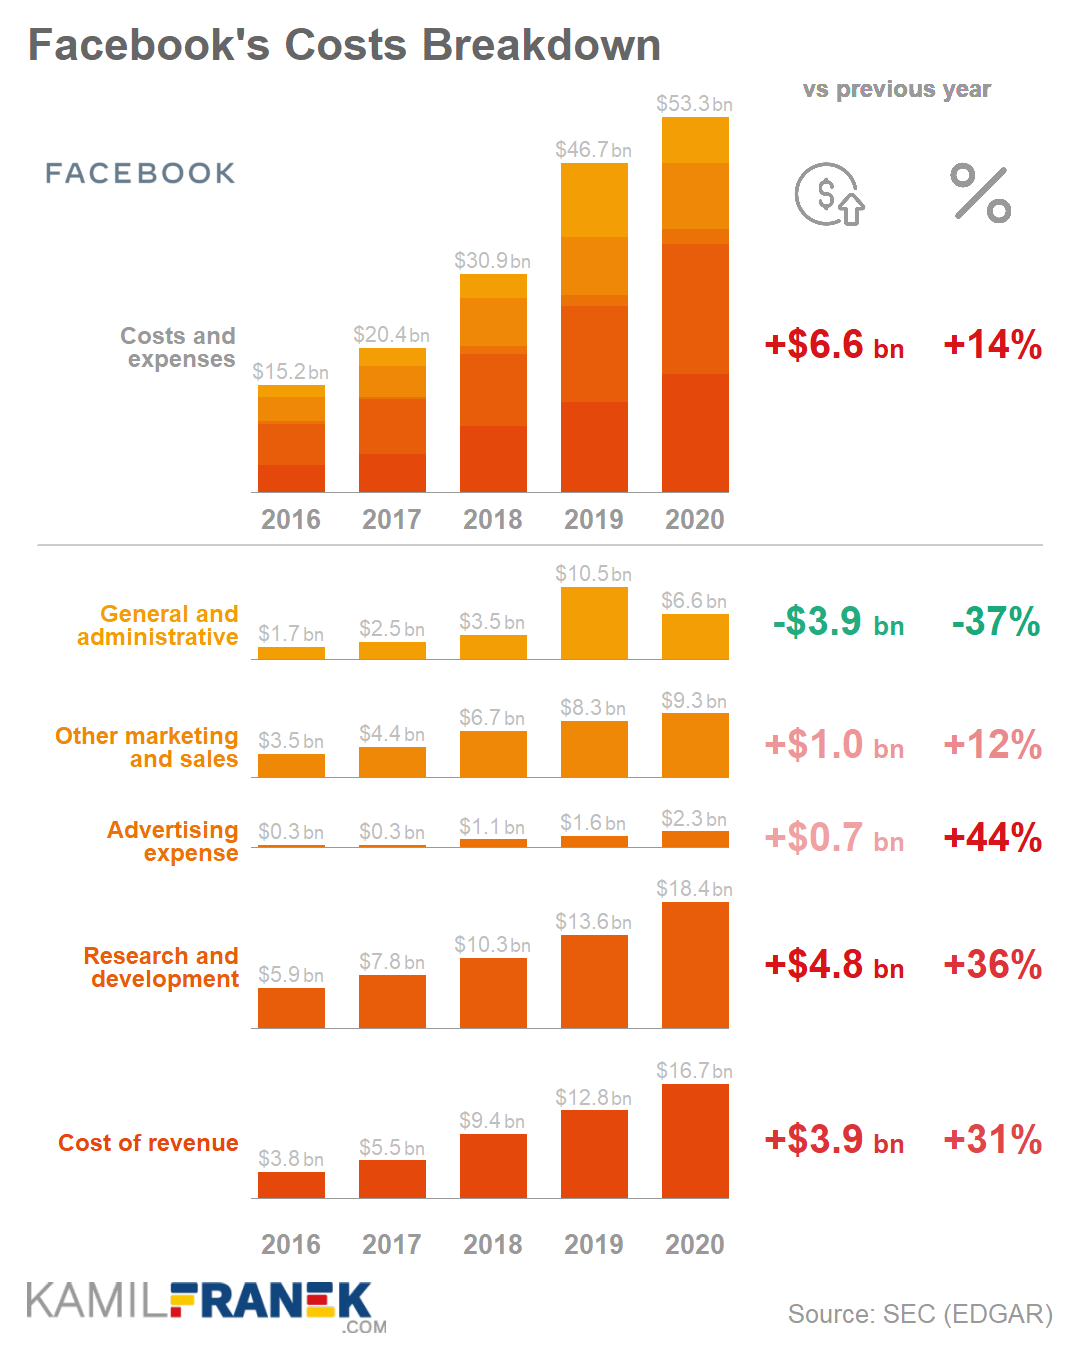
- Facebook’s overall expenses grew 14% to $53bn in 2020. However, this 14% growth results from comparing 2020 expenses to the extraordinary year 2019 when Facebook booked a $5bn FTC penalty and another $0.55bn of settlement expenses. Adjusted for these, Facebook’s expense growth would be +36% in 2020
- 36% adjusted growth of expenses was driven mainly by continued growth (+30%) in the number of employees to 58 604 at the end of 2020 and continuing investments in Facebook’s data centers and technical infrastructure.
- Engineering and technical roles are the biggest group of Facebook’s employees and also the fastest-growing one (+40% in 2020). Growth in R&D employees is the main factor behind research and development expenses that are the largest expense item, growing by 36%.
- Facebook expenses were growing more than revenue. Facebook expects that expenses will grow between 28% and 37% in 2021, which means that the operating margin (38% in 2020) will continue to decrease. If this discrepancy continues for two years, the operating margin will drop to around 30%.
- Facebook’s operating income grew by $8.7bn to $32.7bn in 2020 (+36%). But this is not real growth and just a result of extraordinary low 2019 operating income thanks to a $5bn FTC penalty and another $0.55bn settlement charge. Adjusted for these extraordinary items, the underlying growth of operating income in 2020 was just 11%.
- Facebook net income grew by $10.7bn to $29.1bn in 2020 (+58%), but when adjusted for an extraordinary $5.55 of FTC penalty and settlements booked in 2019, we arrive at a much more realistic 21% growth of net income. Earnings per share were $10.09 in 2020.
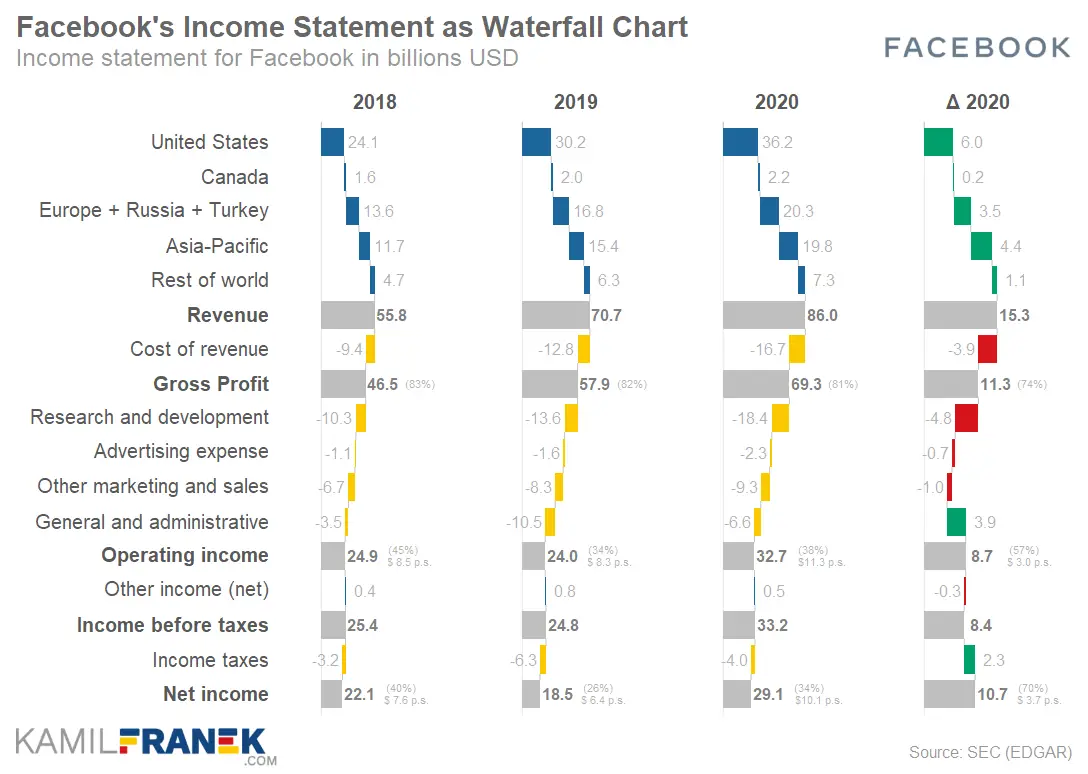
Facebooks’s Income Statement in Table Format
| 2018 | 2019 | 2020 | Δ | %Δ | |
|---|---|---|---|---|---|
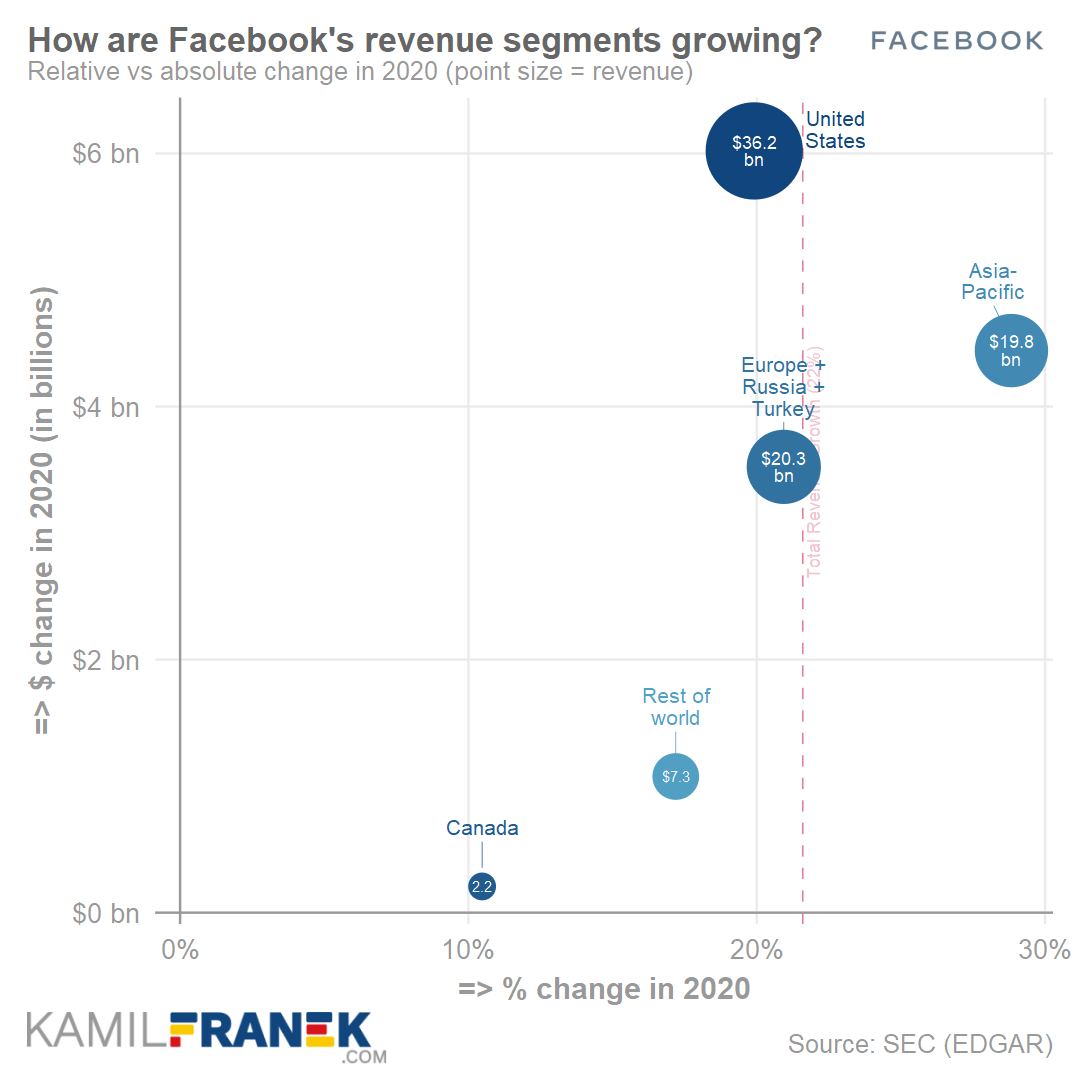
| United States | 24.1 | 30.2 | 36.2 | +6.0 | +20% |
| Canada | 1.6 | 2.0 | 2.2 | +0.2 | +10% |
| Europe + Russia + Turkey | 13.6 | 16.8 | 20.3 | +3.5 | +21% |
| Asia-Pacific | 11.7 | 15.4 | 19.8 | +4.4 | +29% |
| Rest of world | 4.7 | 6.3 | 7.3 | +1.1 | +17% |
| Revenue | 55.8 | 70.7 | 86.0 | +15.3 | +22% |
| Cost of revenue | -9.4 | -12.8 | -16.7 | -3.9 | +31% |
| Gross Profit | 46.5 | 57.9 | 69.3 | +11.3 | +20% |
| Research and development | -10.3 | -13.6 | -18.4 | -4.8 | +36% |
| Advertising expense | -1.1 | -1.6 | -2.3 | -0.7 | +44% |
| Other marketing and sales | -6.7 | -8.3 | -9.3 | -1.0 | +12% |
| General and administrative | -3.5 | -10.5 | -6.6 | +3.9 | -37% |
| Other expenses | - | - | - | ||
| Operating income | 24.9 | 24.0 | 32.7 | +8.7 | +36% |
| Other income (net) | 0.4 | 0.8 | 0.5 | -0.3 | -38% |
| Income before taxes | 25.4 | 24.8 | 33.2 | +8.4 | +34% |
| Income taxes | -3.2 | -6.3 | -4.0 | +2.3 | -36% |
| Other net income | - | - | - | ||
| Net income | 22.1 | 18.5 | 29.1 | +10.7 | +58% |
How Much Cash Facebook Earned and How It Was Spent (Cash Flow Statement Overview)
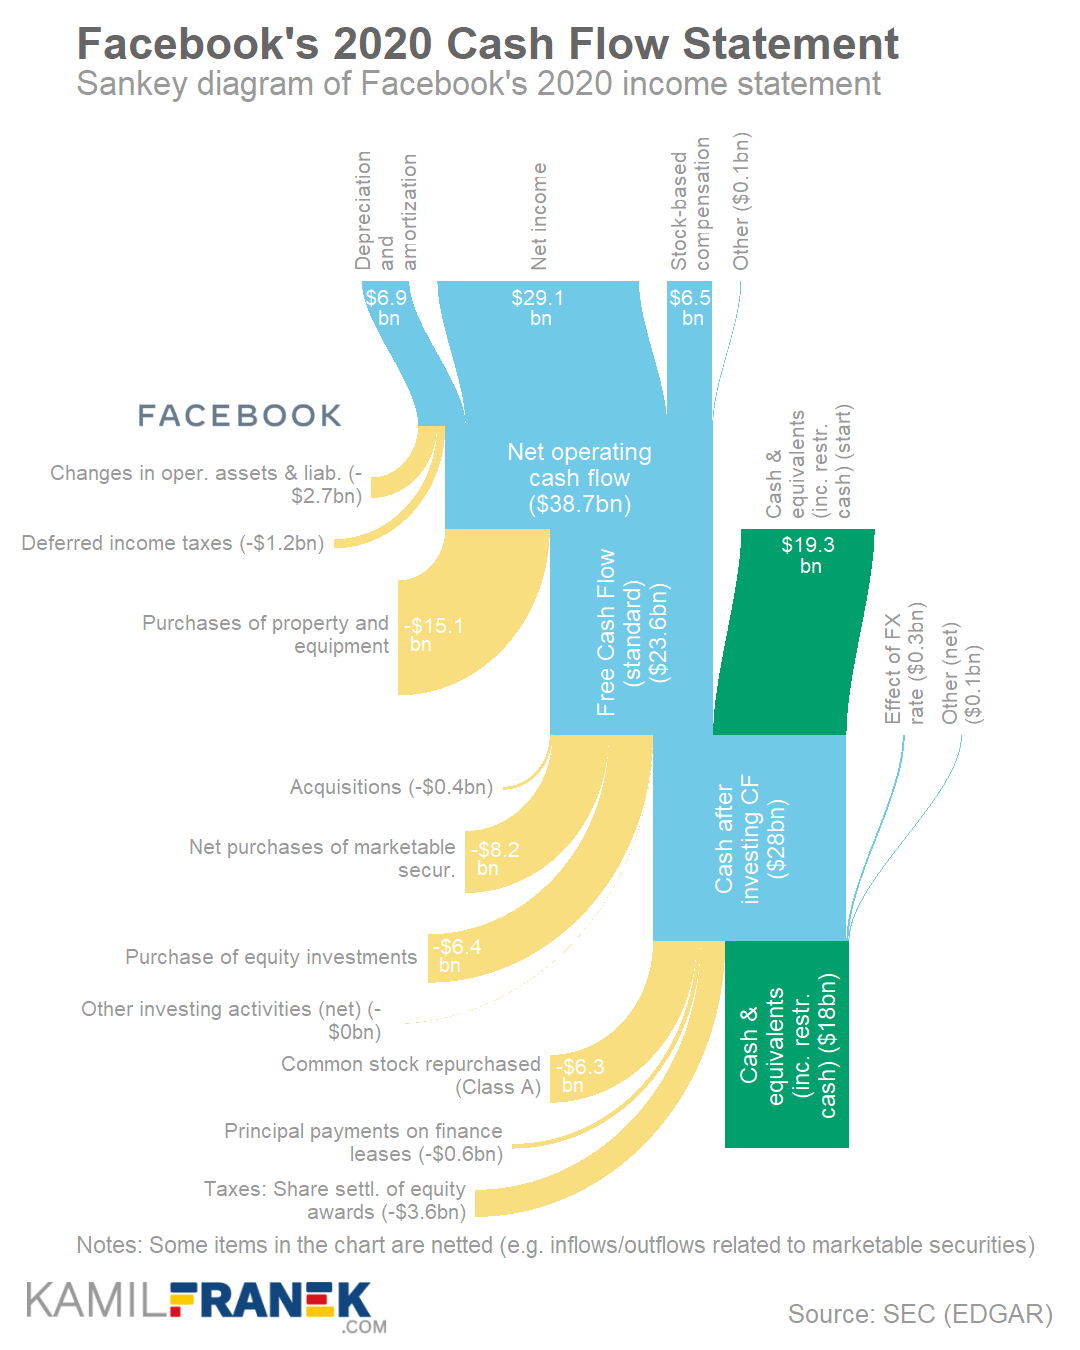
- Facebook generated $38.7bn of operating cash flow in 2020, which was an increase by $2.4bn (+7%) compared to the previous year. Results are even better if you consider that this number includes payment of $5bn FTC penalty.
- Cash Facebook invested in property and equipment was $15.1bn in 2020. It was the same amount as in 2019, but this was not what Facebook originally planned for 2020. Facebook originally planned to invest $17-$19bn but had to reevaluate this due to pandemic-related shelter-in-place orders.
- Facebook will continue to invest heavily in its data center capacity, servers, network infrastructure, and office facilities. Facebook guidance for 2021 is that they will invest between $21bn and $23bn.
- Facebook generated $23.6bn free cash flow in 2020, which was a 11% increase. This free cash flow was used on equity investments ($6.4bn) (majority of which was 9.99% stake in Jio Platform Ltd.) and also to buy back stocks ($6.3bn) but just enough to offset dilution from stock issued as part of employee compensation.
- The last time Facebook bought back stocks exceeding stock-based compensation was in 2018. At the time, Facebook stock prices suffered, and Facebook probably used this to repurchase some equity cheaply.
- A significant part of Facebook’s free cash flow was used to increase Facebook’s cash and its equivalents. Facebook cash pile grew by $7.1bn to $62bn in 2020.
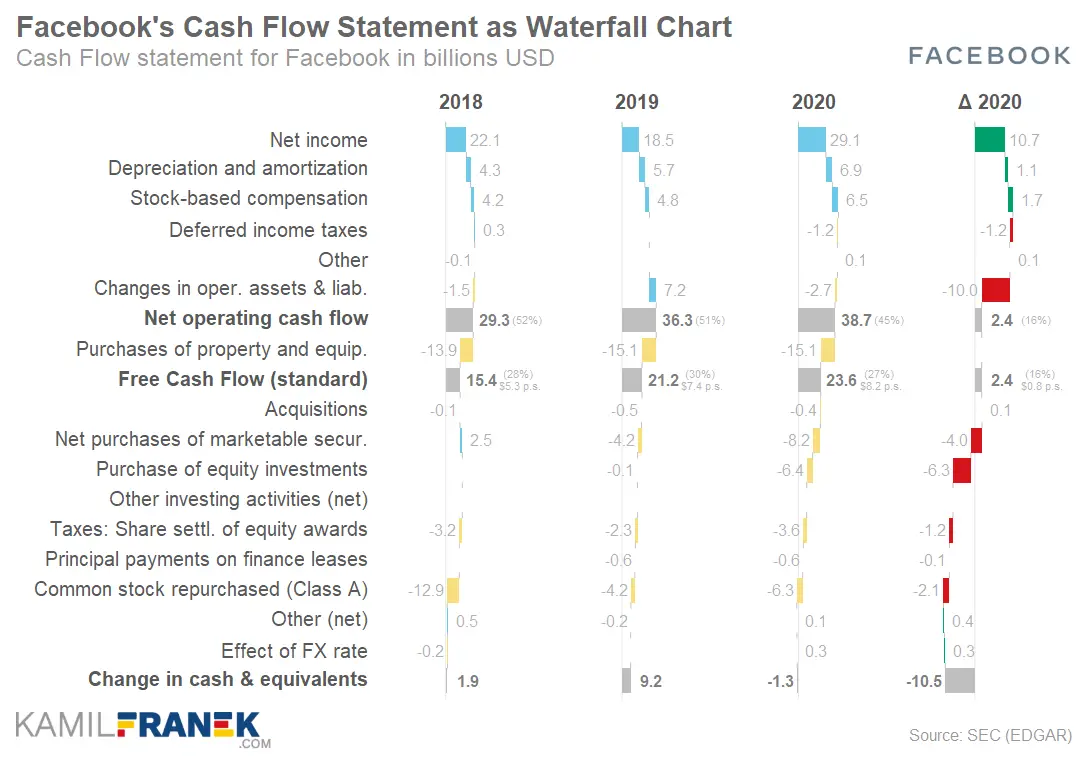
Facebook’s Cash Flow Statement in Table Format
| 2018 | 2019 | 2020 | Δ | %Δ | |
|---|---|---|---|---|---|
| Net income | 22.1 | 18.5 | 29.1 | +10.7 | +58% |
| Depreciation and amortization | 4.3 | 5.7 | 6.9 | +1.1 | +20% |
| Stock-based compensation | 4.2 | 4.8 | 6.5 | +1.7 | +35% |
| Deferred income taxes | 0.3 | -0.0 | -1.2 | -1.2 | +3 122% |
| Tax benefit from share-based award activity | 0.0 | 0.0 | 0.0 | 0.0 | |
| Other | -0.1 | 0.0 | 0.1 | +0.1 | +203% |
| Changes in oper. assets & liab. | -1.5 | 7.2 | -2.7 | -10.0 | -138% |
| Net operating cash flow | 29.3 | 36.3 | 38.7 | +2.4 | +7% |
| Purchases of property and equip. | -13.9 | -15.1 | -15.1 | 0.0 | +0% |
| Proceeds from P&E (sales & incentives) | - | - | - | ||
| Free Cash Flow (standard) | 15.4 | 21.2 | 23.6 | +2.4 | +11% |
| Acquisitions | -0.1 | -0.5 | -0.4 | +0.1 | -24% |
| Net purchases of marketable secur. | 2.5 | -4.2 | -8.2 | -4.0 | +95% |
| Purchase of equity investments | -0.0 | -0.1 | -6.4 | -6.3 | +10 328% |
| Other investing activities (net) | - | - | -0.0 | ||
| Net investing cash flow | -11.6 | -19.9 | -30.1 | -10.2 | +51% |
| Taxes: Share settl. of equity awards | -3.2 | -2.3 | -3.6 | -1.2 | +53% |
| Principal payments on finance leases | 0.0 | -0.6 | -0.6 | -0.1 | +9% |
| Common stock repurchased (Class A) | -12.9 | -4.2 | -6.3 | -2.1 | +49% |
| Other (net) | 0.5 | -0.2 | 0.1 | +0.4 | -171% |
| Net financing cash flow | -15.6 | -7.3 | -10.3 | -3.0 | +41% |
| Effect of FX rate | -0.2 | 0.0 | 0.3 | +0.3 | +6 875% |
| Change in cash & equivalents | 1.9 | 9.2 | -1.3 | -10.5 | -114% |
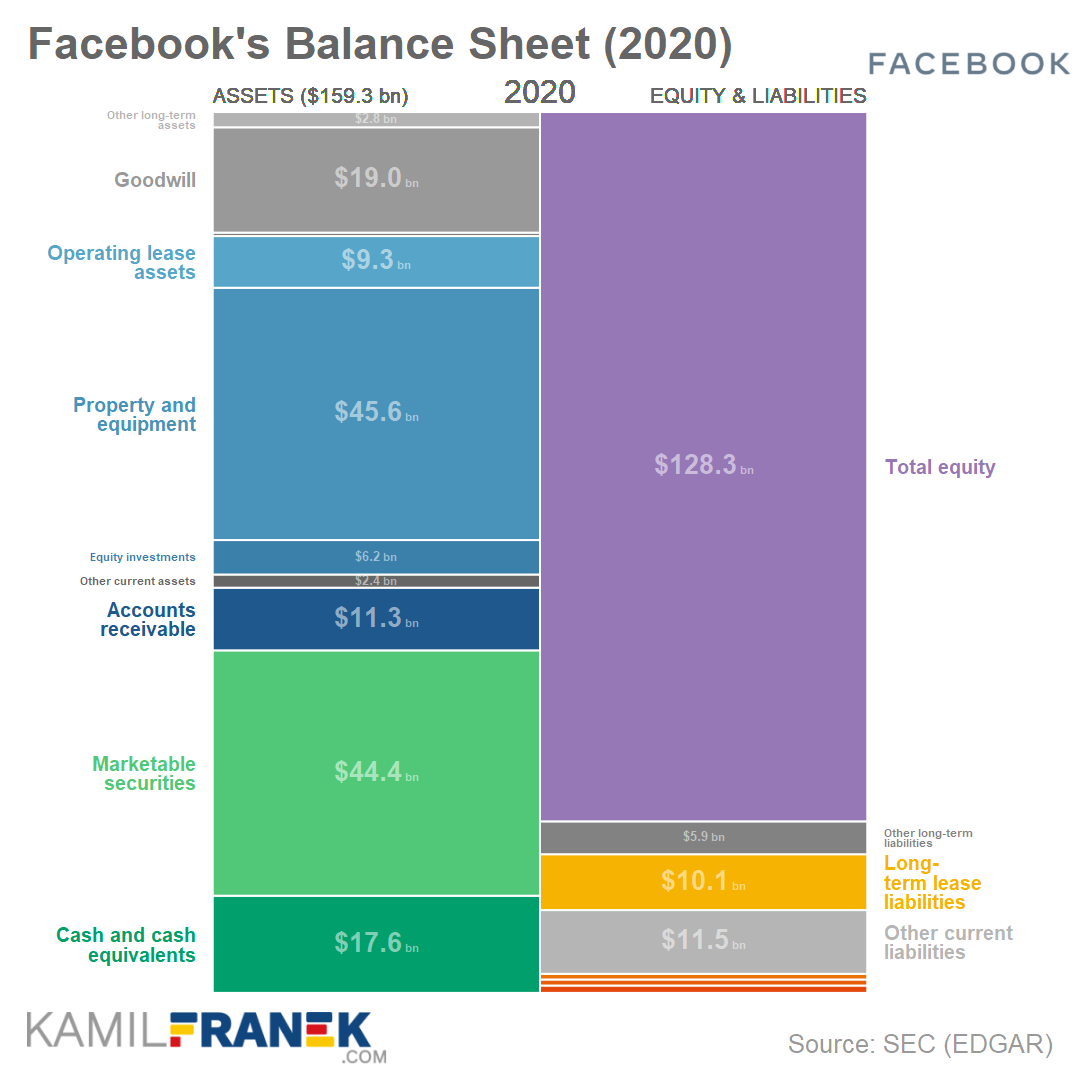
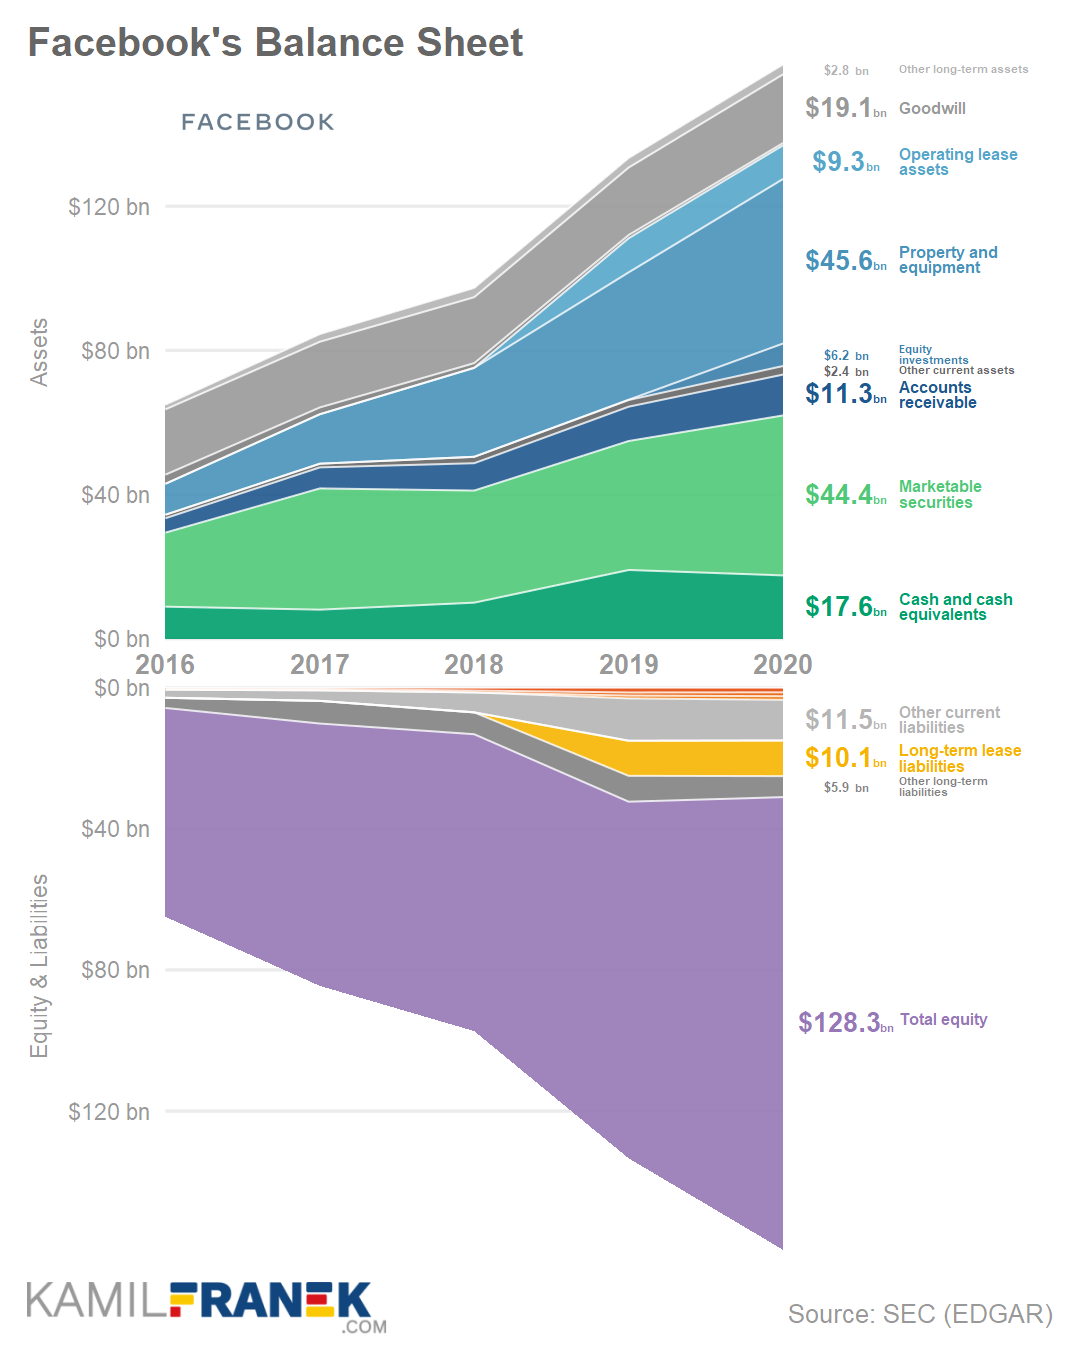
How Facebook’s Balance Sheet Changed? (Balances Sheet Overview)
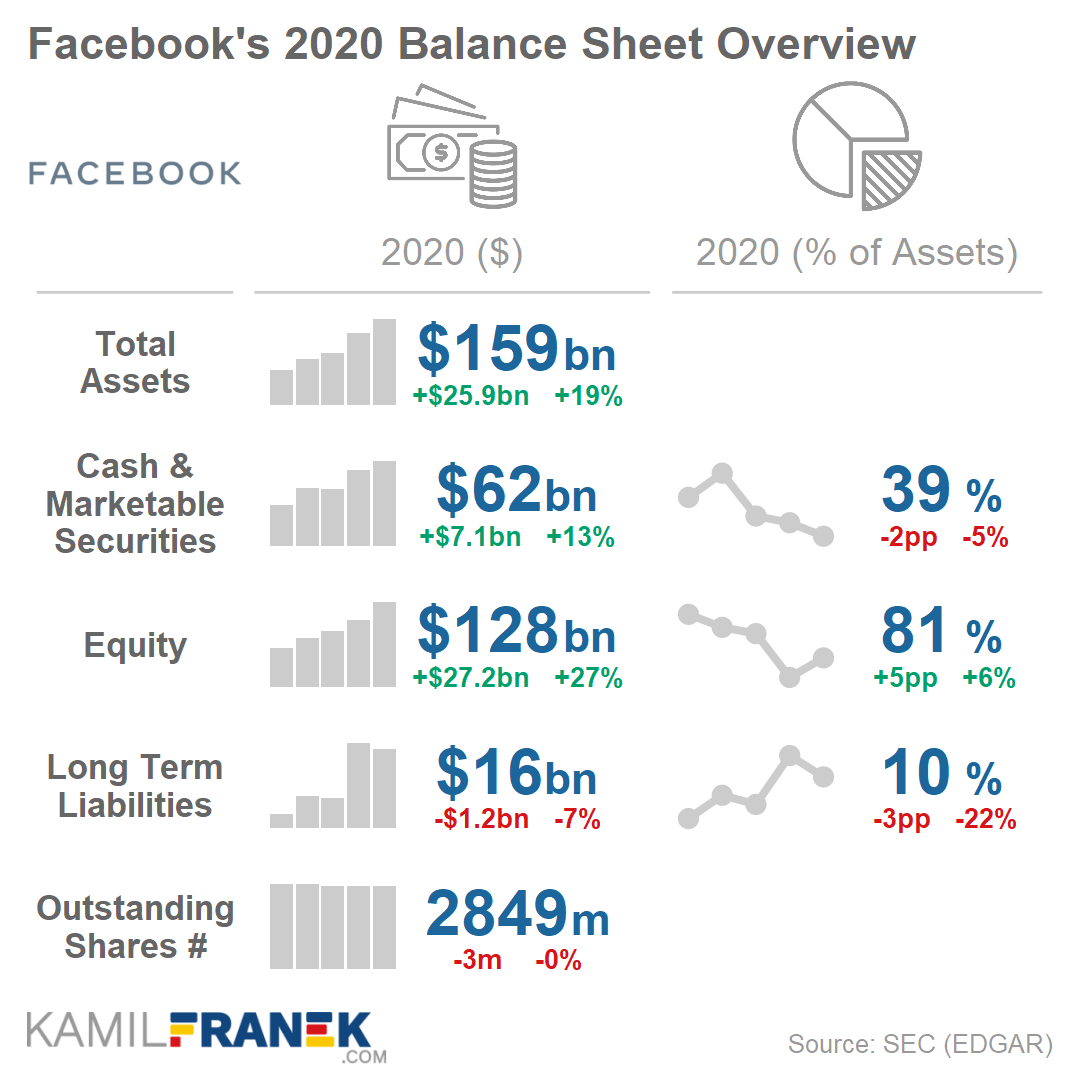
- Facebook balance sheet increased by $26bn to $159bn in 2020. The main changes in assets were a $10.3bn increase in property and equipment, a $7.1bn increase in Facebook “cash pile,” and a $6.1bn increase in equity investments.
- An increase of $10.3bn of Facebook’s property and equipment was driven by both purchases of buildings and investment in networking equipment that was partially offset by depreciation. Buildings included both data centers and also increase in office space.
- Facebook’s cash and cash equivalents (“cash pile”) increased by $7.1bn to $62bn. As is usual for technology companies, cash and cash equivalent have a high share of total assets. The cash pile represented 39% of Facebook’s assets at the end of 2020.
- Facebook has $19 billion of Goodwill on its balance sheet, and most of it is a result of WhatsApp acquisition in 2014 for $19bn.
- The most unusual part of Facebook’s balance sheet is its assets and liabilities side, where 81% of the balance sheet is equity. Facebook does not have any long-term debt except its lease liabilities.
Facebook’s Balance Sheet in Table Format
| 2018 | 2019 | 2020 | Δ | %Δ | |
|---|---|---|---|---|---|
| Cash and cash equivalents | 10.0 | 19.1 | 17.6 | -1.5 | -8% |
| Marketable securities | 31.1 | 35.8 | 44.4 | +8.6 | +24% |
| Accounts receivable | 7.6 | 9.5 | 11.3 | +1.8 | +19% |
| Other current assets | 1.8 | 1.9 | 2.4 | +0.5 | +29% |
| Equity investments | - | 0.1 | 6.2 | +6.1 | +7 149% |
| Property and equipment | 24.7 | 35.3 | 45.6 | +10.3 | +29% |
| Operating lease assets | 0.0 | 9.5 | 9.3 | -0.1 | -1% |
| Intangible assets | 1.3 | 0.9 | 0.6 | -0.3 | -30% |
| Goodwill | 18.3 | 18.7 | 19.1 | +0.3 | +2% |
| Other long-term assets | 2.6 | 2.7 | 2.8 | +0.1 | +3% |
| Total assets | 97.3 | 133.4 | 159.3 | +25.9 | +19% |
| Accounts payable | 0.8 | 1.4 | 1.3 | 0.0 | -2% |
| Partners payable | 0.5 | 0.9 | 1.1 | +0.2 | +23% |
| Operating lease liabilities (current) | 0.0 | 0.8 | 1.0 | +0.2 | +28% |
| Other current liabilities | 5.7 | 12.0 | 11.5 | -0.5 | -4% |
| Long-term debt | - | - | - | ||
| Long-term lease liabilities | 0.0 | 9.9 | 10.1 | +0.2 | +2% |
| Other long-term liabilities | 6.2 | 7.3 | 5.9 | -1.4 | -19% |
| Total equity | 84.1 | 101.1 | 128.3 | +27.2 | +27% |
| Total liabilities and equity | 97.3 | 133.4 | 159.3 | +25.9 | +19% |
Data source for the above visuals and tables are Facebook’s annual reports (K-10) that the company submits to the Security and Exchange Commission (SEC) or other documents that Facebook provides to investors.
🔵 Breakdown & Analysis of Facebook’s Revenues (Income Statement)
Facebook’s revenue was $86bn in 2020, growing by 22% annually. Advertising was responsible for nearly all of it, and only 2% of revenue was coming from other activities, primarily from hardware sales. Geographically, the biggest part of Facebook’s revenue (42%) was from the United States.
Facebook is quite cautious when giving guidance about its future revenue growth. Their view is that Facebook has benefited from two trends playing out during the pandemic that impacted its income statement.
The first is the ongoing shift to online commerce, and the second is the shift in consumer demand towards products and away from services. These shifts provided a boost to Facebook’s advertising business in the second half of 2020, and if some of those trends reverse, it might drag the revenue growth in 2021.
On top of that, 2021 will bring another negative event that will push revenue growth down. I refer to the privacy changes in iOS 14.5 and the “evolving regulatory landscape,” as Facebook nicely calls its antitrust and content moderation issues.
The level of detail that Facebook offers about its revenue in its financial statements is relatively low. Facebook does not break down how much revenue is coming from Instagram, Facebook, or WhatsApp. The only segment split that the company offers is split into advertising revenue and fees. That does not give a lot of clarity, as you can see, or more precisely not see, from the chart below.
The only notable points to make from the chart above are that Facebook earns the most revenue from advertising and “Other” revenue after years of being flat jumped by 76% in 2020. This was driven mainly by Facebook’s success with sales of Oculus 2 VR headset and partially also Portal devices. Hardware sales are now the main part of “Other” revenue.
Fortunately, we don’t need to rely only on Facebook’s official data. We can get some reasonably good estimate of where the revenue is coming from based on aggregated data of thousands of advertisers that use Facebook’s ad platform.
For example, we can use Social Media Trend Report by Socialbakers to see that at the end of 2020, the biggest revenue generator was Facebook feed with a 57% share on ad spend. It was followed by Instagram feed with 16% share and Instagram stories with 11% share on ad spend.
When we add Instagram share from feed and stories together with small share spend on Instagram explore tab ads, we get a total Instagram share on Facebook advertising revenue of 29%, which translates into $24bn annual revenue in 2020.
In 2019 share of Instagram ad spend was also around 29% which would mean $20bn annual revenue.
Bloomberg reported the same $20bn revenue amount based on some “unknown source,” so our estimate is in line with that.
You can see that in 2020, Instagram was not such an impressive revenue growth driver as in 2019 when it was growing much more quickly than Facebook. At this moment, it is hard to speculate if it is because of specific pandemic-related factors or some more fundamental change of trends.
Another thing to note is that nearly all revenue in Facebook’s income statement comes from mobile, and the share of desktop advertising on revenue is just low single digits.
Overall, Facebook’s revenue grew by 22% in 2020. At the end of 2019, when revenue grew by 27%, Facebook expected that this growth would slow down in 2020, but the reality was even more drastic thanks to the COVID-19 impact.
“We expect our revenue growth rate will continue to decline over time as our revenue increases to higher levels.”
— Facebook, 2019 10-K
The expectation of declining revenue growth seems understandable given Facebook’s already high penetration among internet users, as the slower user growth will drive slower revenue growth.
However, even revenue growth of around 20% would still be formidable for such a large company. Of course, it pales compared to the 50% revenue growth that we saw just a few years ago.
Regarding the level of detail based on geography, Facebook offers reasonable detail directly in its financial statements, similar to what other companies provide.
The biggest geographical region in terms of revenue was the United States, with $36bn revenue in 2020. We can see from the chart below that revenue growth is roughly consistent across most of the regions, but revenue in Asia-Pacific countries is experiencing higher growth. Still, the biggest share of revenue is coming from developed countries.
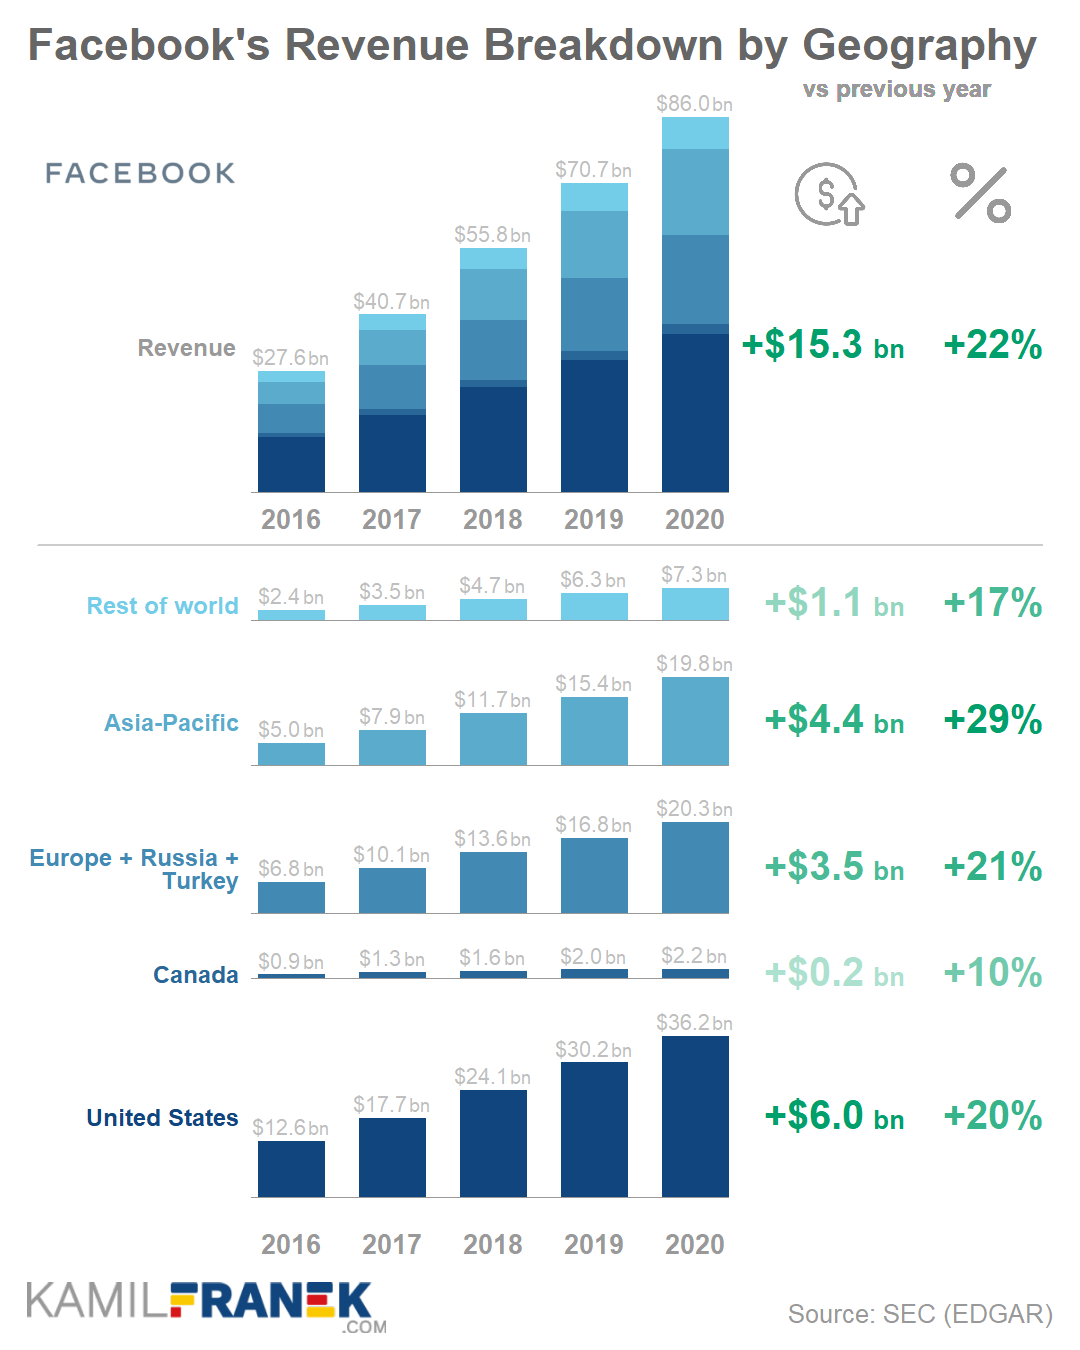
Asia-Pacific region’s share of revenue is increasing over the years while the combined share of developed countries decreases. This development is mainly a result of much faster growth of users in the Asia-Pacific region compared to the growth of users in developed countries.
Higher growth in Asia compared to traditionally developed countries is not just some temporary impact from the pandemic. In 2019 growth of developing regions was around 30% and of developed countries around 20%.
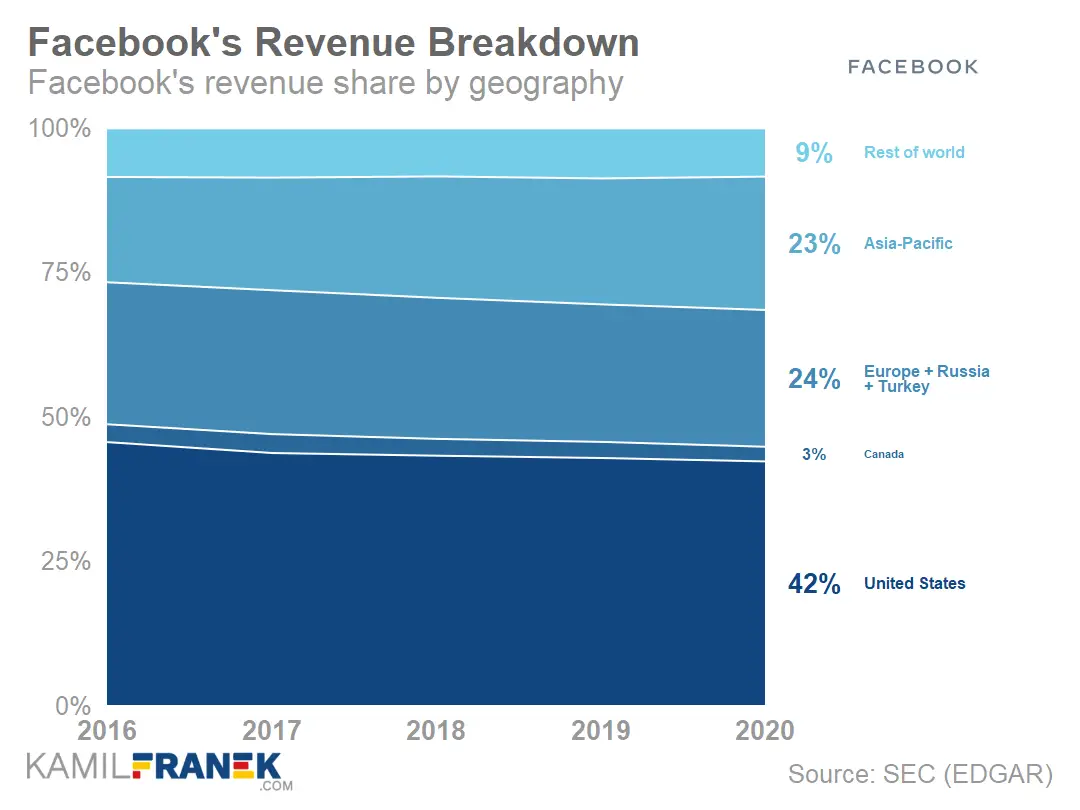
Share of the US revenue is significant even though US & Canada users’ share on total monthly active users was “only” 9%. This discrepancy between share on users and share on revenue exists because the US’s average user is much more valuable for advertisers than an average Asia-pacific user.
Asia is a crucial region for Facebook and its future growth. Facebook was banned in China in 2009, and Mark Zuckerberg spent a lot of time and energy trying to get Facebook back there. He even started to learn Mandarin Chinese and met with Xi Jinping. As he told analyst in 2015:
“Obviously, you can’t have a mission of wanting to connect everyone in the world and leave out the biggest country.”
— Mark Zuckerberg, Facebook’s CEO
Recently, however, as Facebook realized this is not going to happen any time soon as the US approach to China changed, India became its main focus in Asia.
Currently, India is its most important market in Asia, even though India is not recently as welcoming to foreign tech companies as it used to be.
Facebook was first trying to lure Indians into its “Free basic” service, which allowed users access to a data-light version of Facebook and some other apps for free, without a need for a data plan. India blocked this attempt in 2016 since it violated net naturality.
Facebook also had issues when trying to launch payment services within WhatsApp using India’s centralized UPI system. Facebook partially succeeded in 2020, and WhatsApp payments were approved but with the caveat of a 20 million user cap. Given that India’s WhatsApp user base is in hundreds of millions, this cap will become a limiting factor very soon.
Recently, Facebook acquired 9.99% in company Jio Platform Ltd that brought fast and cheap internet to hundreds o millions of Indians, and is currently the top mobile data provider in India.
This new partnership should allow WhatsApp users to easily purchase goods through Jio’s new e-commerce platform, but we will have to see how this partnership will exactly work.
Core drivers of Facebook’s advertising revenue are how many people use Facebook, how much time these users spend on Facebook, how many ads Facebook shows to its users per specific time, and finally, how much Facebook charges for one ad placement.
To make it more apparent how those revenue drivers work together in Facebook’s income statement, we can put them all into the revenue formula, as you can see below.
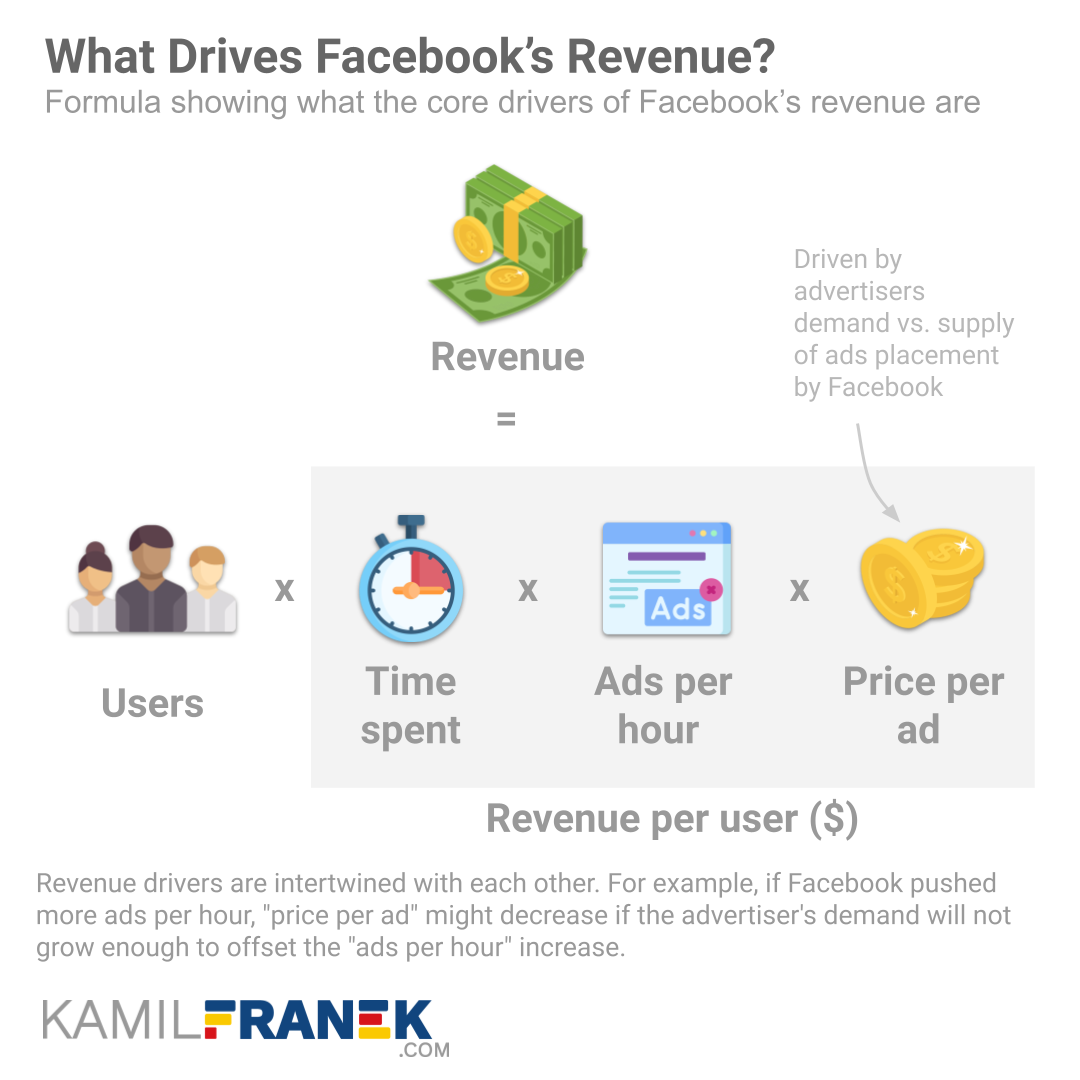
This revenue formula tries to show Facebook’s core revenue drivers and how they are connected. It is a simplification, the reality is much more complex, and many of the drivers are also mutually connected and influence each other.
Still, I like it as a way to summarize what Facebook business is actually about and as a guide when I consider how different actions by Facebook and related events might impact its revenue.
Suppose any part of the formula is growing. In that case, it usually means that revenue is going up and vice versa, but we need to carefully consider if some changes do not influence multiple drivers in opposite directions.
I go into more detail about this revenue formula and how Facebook makes money in my article How Facebook Makes Money: Business Model Explained.
Facebook’s Users and Revenue Per User Breakdown
Facebook had 3.3 billion monthly users at the end of 2020 across all of its products, which makes Facebook the most significant player, by far, among social media and messaging tools. COVID-19 pandemic drove more users to Facebook. Its users grew 12% in 2020 compared to 8% growth the year before.
The year 2020 was an outlier in terms of user growth. Facebook is so big that its users usually grow in line with the number of internet users worldwide. However, in 2020, Facebook users’ growth outpaced internet users’ growth.
Let’s put these numbers into perspective based on Digital 2021: Global Overview Report by datareportal.com.
There are 4.7bn internet users currently, who make up 59.5% of the world population.
The vast majority (90%) of people who have internet access are also active on social media. The total number of social media users worldwide is 4.2 billion, which is 54% of the world population.
That all means that with 3.3bn users, Facebook dominates the social media field as more than three-quarters of people who use social media use Facebook, Instagram, or WhatsApp.
Facebook started to report the total number of monthly active users across all of its apps ($3.3bn in 2020). However, since it does not offer too much detail split for this number, I will focus on the older metric that includes only users who use the Facebook app or Messenger. The number is very close, reaching 2.8bn at the end of 2020 since users who do not use the Facebook app and use only Instagram or WhatsApp are rare.
Let’s break down this number more in detail based on geography and revenue per user. These are essential core revenue drivers for Facebook since users are the main Facebook’s asset, even though they are not part of Facebook’s official balance sheet.
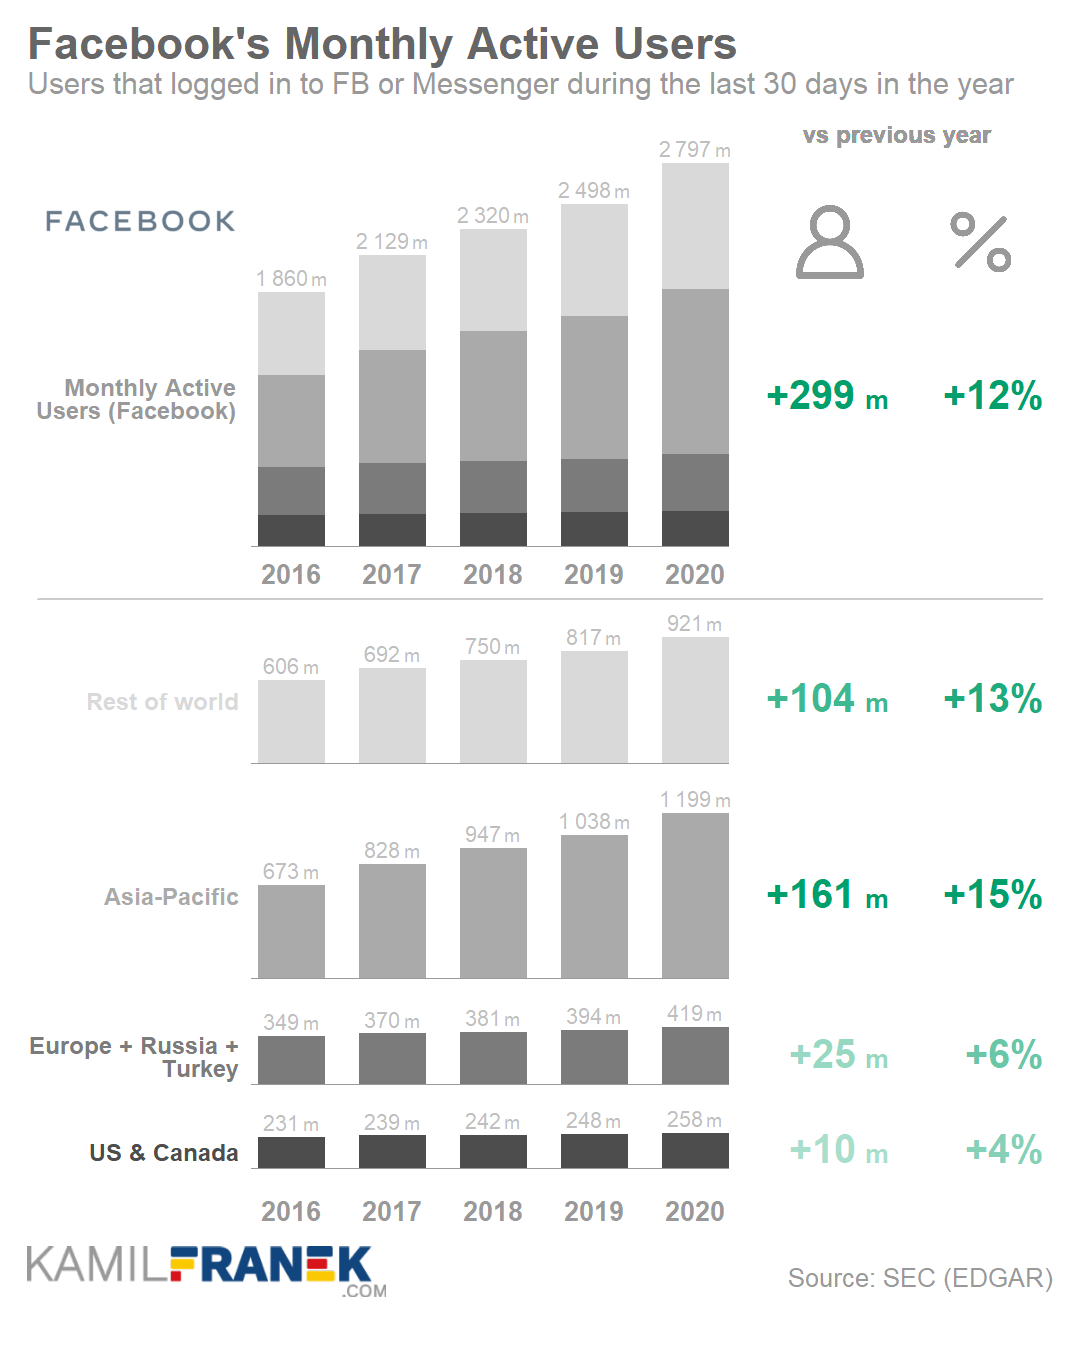
The above’s chart main point is that Facebook is still growing strongly in the number of users. Sometimes, based on media coverage, it might seem that Facebook is experiencing a vast exodus of users who are “deleting” and “boycotting” Facebook. However, as you can see, overall, the Facebook user base is still growing, even in the US.
The number of users dropped slightly at the end of 2020 based on quarterly data, but even with this drop, they grew more than the year before.
We cannot expect 12% user growth to continue, and it will probably drop back to high single digits. That means that Facebook will be able to hold on to its high market share among users, and its growth will be mainly thanks to general growth in the number of people who use the internet. In the case of a Facebook’s size company, just keeping its market share stable is a great achievement.
The dependence of Facebook users’ growth on the internet users’ growth is also one reason behind the growth difference in North America and Europe compared to Asia-Pacific and the rest of the world.
The majority of people in more countries like the US and western Europe are already online, and user growth is in the low single digits. On the other hand, the Asia-Pacific region and the rest of the world are growing more quickly, driven by a lower proportion of the population with access to the internet.
The growth of internet users will continue going forward, and it will be slowly decreasing as internet access will become more available worldwide. It will continue to be the significant driver of Facebook’s user growth.
Social media and messaging apps users are extremely “sticky” to the app they are accustomed to because the switch from one social media or messaging app to another is very hard. It is not enough that the users themselves will move, but it also requires that most of their social circle has to be available in a new app. These ” network effects” naturally drive users to the most popular apps, giving an advantage to already established ones.
It might look that Facebook’s position as a dominant platform is strong and impenetrable. However, the same “stickiness” of users and network effects that helped Facebook so far to build and hold on to its dominance will weaken it going forward because of its weakness among younger users.
Facebook is still strong among younger users, thanks to its Instagram app, but its position is not so dominant as among the older population. In the US, the most popular social network app among teenagers is Snapchat, followed closely by Instagram.
The probability of some new acquisition that would plug this weakness and increase Facebook’s market share among the younger generation is not very probable amid current antitrust pressure.
That means that the same network effect that once helped Facebook keep its dominance among older users will now play against them among the younger generation.
That does not mean that Facebook is on the verge of an inevitable decline in users. Demographic changes will take decades and will only slowly offset general growth thanks to growth in internet users.
Facebook’s future in 20 years is much more dependent on Facebook’s business decision going forward than on the fact that Facebook is currently weaker among teenagers.
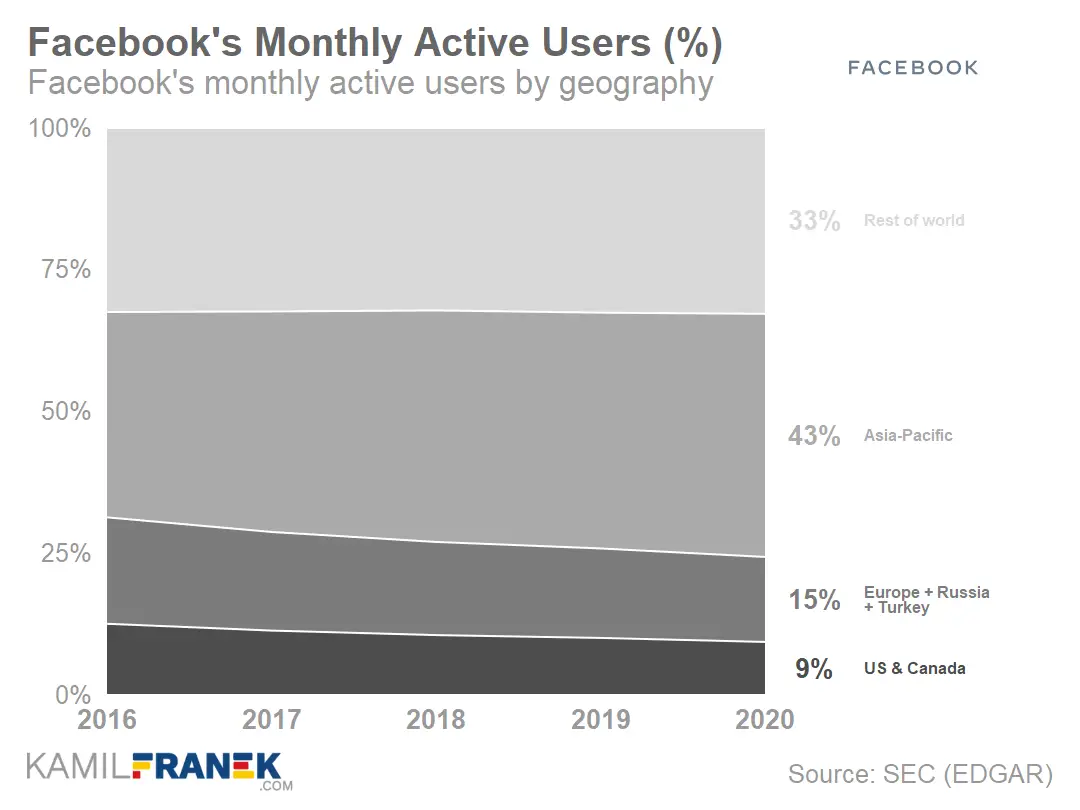
Users from the United States are just a tiny fraction of Facebook’s worldwide users. Because users’ growth will happen mainly outside developed countries, Facebook will become even more international business going forward.
The small share of US users on total Facebook users does not mean that US users are not critical for Facebook. They are. 42% of revenue was still coming from the US because of higher revenue per user.
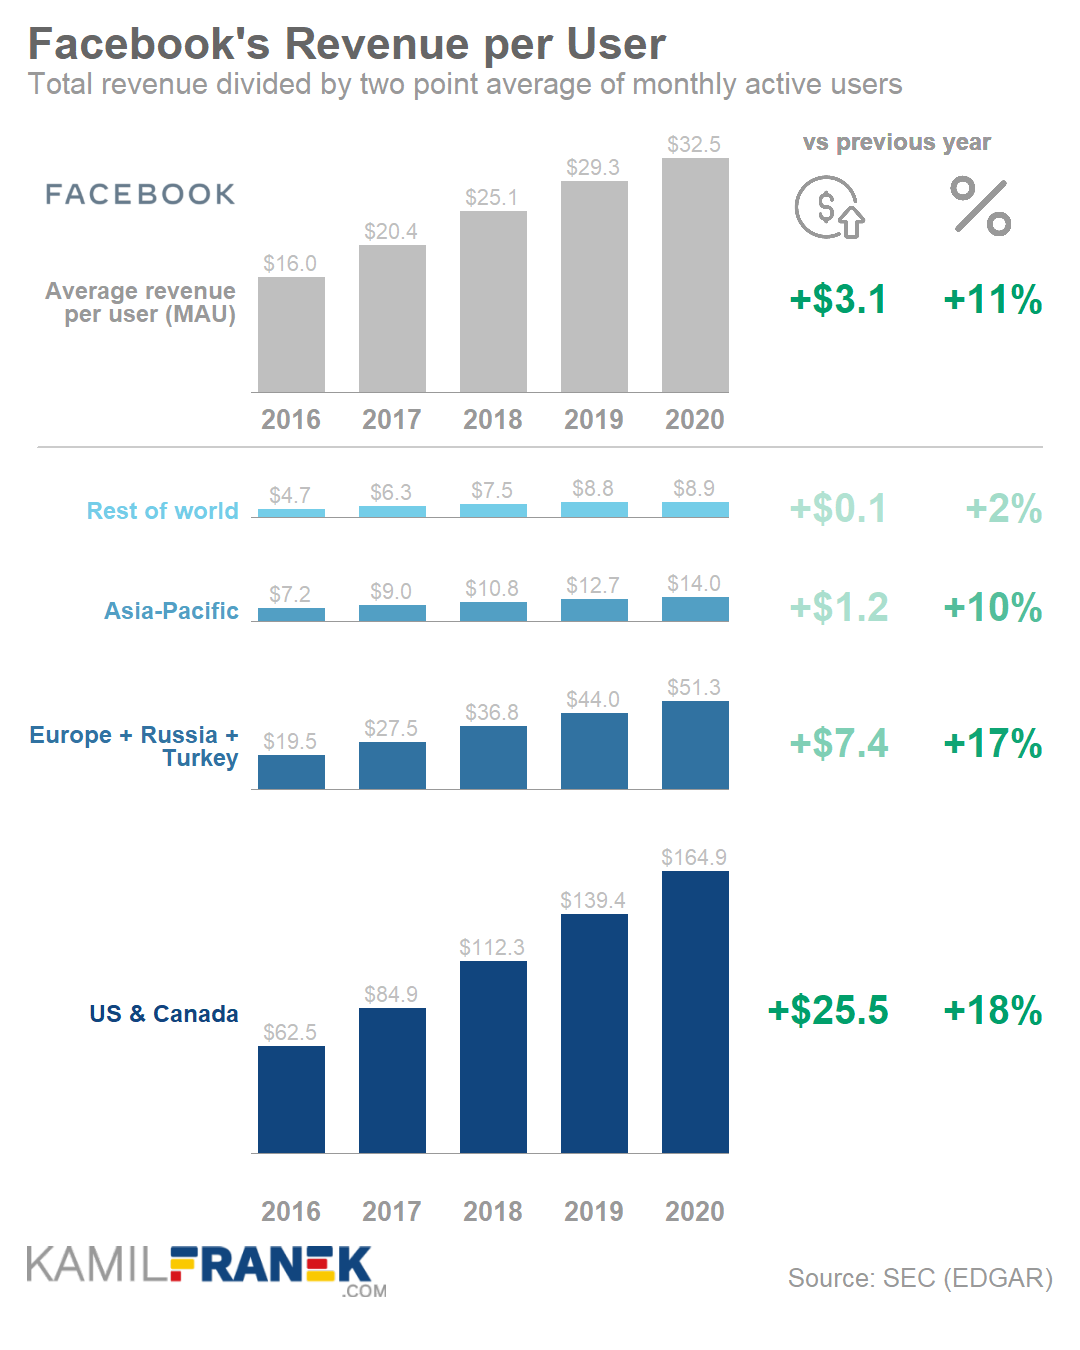
In the US, Facebook earns $165 on average from each of its users a year. That is nearly $14 a month per user, roughly the price of a monthly Netflix of HBO Max subscription. We might think of it as a “reverse” streaming subscription fee that advertisers pay to Facebook to be able to “stream” ads to its users.
Interestingly, this difference in how much revenue per user Facebook earns from the US compared to Asia continues to increase. Revenue per user in the US grows more quickly than in Asia.
There is one issue with the revenue per user data above. It considers all Facebook revenue, but it only divides it by users who used Facebook “blue” app. This approach overestimates revenue per user slightly, but this difference is not insignificant as revenue for Facebook’s users that do not use Facebook’s “blue” app is small. They represent mainly WhatsApp users who are not monetized.
Another issue is that users that Facebook reports in its official number also include false and duplicate accounts. Facebook estimates that these accounts represent around 16% of Facebook’s users.
Facebook Advertising Revenue: Facebook vs Instagram
![]()
Facebook earns most of its revenue from selling advertising mainly within its Facebook app and increasingly on Instagram. WhatsApp, the Facebook messaging platform it acquired in 2014, currently does not generate any advertising revenue.
Facebook uses an auction system to sell ads on its platform, which enables them to optimize revenue. It also means that ads’ price is highly dependent on the supply of ad spots by Facebook and the demand for them by advertisers.
Facebook’s advertising revenue was $84bn in 2020, growing 22% annually. Advertising continues to be the only significant source of Facebook revenue, representing 98% of $86bn of Facebook’s total revenue.
Growth in Facebook’s revenue by 22% was driven mainly by an increase in the number of ads served by Facebook by 33%. This growth in the number of ads was partly offset by a 10% decrease in price per ad.
In terms of the number of ads, 33% growth was similar to the previous year. However, prices dropped far more in 2020 (-10%) than in 2019 (-5%) thanks to the impact of the COVID-19 pandemic.
If we look more years back, then we would see that Facebook achieved revenue growth through a combination of growth in ads delivered and an increase in price per ad.
It seems that in the last two years, Facebook increased the frequency of ads within people’s feeds or stories.
The prices per ad decreased in 2019 mainly because ads offered as Stories ads are cheaper than standard “feed” ads, and their proportion increased. Reasons for the 2020 decrease are similar, just with added pandemic impact during the first half of 2020.
Also, as we saw from the breakdown of users by geography, the proportion of users from geographies where the price per ad is lower, like the Asia-Pacific region, is increasing.
Facebook has so dominant market share among social media users thanks to its Facebook, Instagram, and WhatsApp apps, that it is often referred to as a monopoly.
However, Facebook users are not its core customers. Facebook’s core customers are advertisers, and Facebook’s market share on the roughly $130bn US digital advertising market is 23%, second to Google with 32%. Amazon, another tech giant, recently became an important digital advertising player too and reached a market share of 8%.
From this perspective, it is hard to speak of monopoly.
Facebook revenue is mainly based on small businesses and not big companies. Therefore past “boycotts” by big advertisers did not cause any noticeable revenue decrease.
Facebook does not provide investors the split of revenue for how much from $84bn of advertising revenue is generated by the Facebook app and how much by Instagram.
Fortunately, we can estimate this based on data on how advertisers spend money between Facebook and Instagram.
Based on ad spend data, it looks that Facebook’s app share on total revenue at the end of 2020 was 59% without counting video-related ad revenue, compared to 66% just a two year ago. Instagram share on advertising spend at the end of 2020 was 29% compared to 26% two years ago.
That leaves around 15% share for other advertising revenue, including revenue from video, Facebook Audience Network, and others.
Going forward, the demand for ads can increase thanks to Facebook’s introduction of Facebook Shops, which should enable users to have a much more pleasant experience since everything, including check out, would be handled within the app where the customer currently is.
If Facebook Shops will be successful, then the main benefit is a higher demand for ads, which means higher prices and higher revenue.
Advertising Revenue of “Blue” Facebook App
![]()
Facebook’s original “blue” app is still the most important part of Facebook, having the most users and bringing in the most revenue. Facebook earns revenue mainly from selling advertising in the main Facebook feed, but it also earns revenue from advertising within the Market Place, Watch tab, and Facebook Stories.
The estimated share of core Facebook app on advertising revenue is around 59%, and the core part of this (57%) is Facebook Feed. About 1% is attributable to Market Place ad revenue, which is growing strongly but is still quite a small revenue stream.
We should not forget about Facebook Stories, but their share of advertising revenue is estimated to be below 0.5%.
Facebook made significant investments into original content for Facebook Watch. It still invests money into content, but its strategy shifted from scripted shows more into talk shows and sports clips. Like YouTube, Facebook also shares 55% of advertising revenue with creators who upload videos to Facebook Watch if they reach certain engagement milestones.
The company, on the one hand, touts that the number of Watch users is over 1.25bn and claims it continues investing in it. However, data suggest that the share of video ad revenue on total is just in the low single digits so far.
Facebook Advertising Revenue from Instagram
![]()
Instagram is becoming a more and more important source of growth for Facebook. Not only in user growth and engagement but also in revenue. Instagram stories alone were responsible for a large part of Facebook revenue growth in 2019.
Instagram currently has over 1 billion users, and even without Facebook, it would belong among top social media companies.
The estimated share of Instagram on total Facebook’s advertising revenue was 29% at the end of 2020. Around 16% of total Facebook revenue is generated through Instagram Feed and 11% through Instagram Stories.
Even in the volatile pandemic year 2020, revenue related to stories grew faster than revenue from classic feeds and increased share from 10% of advertising revenue to 11%.
However, this growth was far from what we saw in 2019, where Instagram Stories share on ad revenue grew from 6% to 10%.
Instagram serves advertising also on its “Explore” tab, but its share on Facebook revenue is estimated to be just around 2%.
Instagram revenue did not grow so rapidly in 2020 as in the previous year, and its share of total revenue did not change significantly.
By applying a 29% share to $84bn of advertising revenue, we will arrive at an estimate of Instagram revenue of $24bn in 2020.
Of course, this is an estimated number based on third-party data, which does not have to be entirely representative. However, the same approach in 2019 delivered an estimate of around $20bn, which is precisely the same number that was leaked to Bloomberg.
Part of Instagram is also an IGTV service launched in 2018 and offered as a way to share and watch long-form video content. So far, IGTV does not seem to be a success story. However, it looks that in 2021 company plans to start monetizing IGTV videos and share revenue with video creators in a similar way they are used to from YouTube.
It is good news for video creators but mainly for Facebook itself since video can turn into another revenue stream, even though it won’t be anything revolutionary, at least for a few years.
Facebook also reacted to the success of TikTok by launching Instagram Reel within Instagram as a TickTock alternative. Between 2018 and 2020, Facebook even had a separate app that looked like a TickTock called Lasso, which was just a separate app for Instagram Reels. It closed the service in 2020, but Instagram Reels stayed part of Instagram.
Facebook Other Advertising Revenue
Facebook and Instagram are the core revenue generators, but Facebook also has some other smaller advertising revenue sources.
For example, the Facebook Messenger app also shows ads, contributing to Facebook advertising revenue in some small way.
Facebook also makes money by running its Audience Network, which developers can use to monetize their app with ads. Facebook earns money by taking a one-third cut from advertising revenue that gets generated this way. The net revenue contribution of Audience Network is probably around $1bn.
Facebook also announced that the new Apple iOS change planned for spring of 2021 would limit the possibility of user tracking. According to Facebook, complete removal of personalization from ads would decrease ad revenue by up to 60%. However real impact will be much milder because the changes limit only access to data outside Facebook.
Facebook’s Other Revenue
Facebook business is primarily about advertising, but it also earns revenue from other non-advertising activities. This revenue is small today and was close to $2bn in 2020, which is 2% of total Facebook’s revenue.
Until recently, this non-advertising revenue was not doing well and was decreasing slowly for years. It changed in 2018. And even though we can’t expect other revenue to overcome advertising revenue any time soon, it will continue to grow.
Facebook’s other non-advertising revenue grew by 72% in 2020 to $2bn. This revenue includes many different revenue streams, but the majority of it is hardware. Mainly Oculus and, to a lesser extent, also Portal. These devices are also the main drivers of revenue growth in the last two years.
What is also important to note is that, unlike advertising, Facebook’s other revenue is highly concentrated in the US & Canada, with a 64% share of non-advertising revenue.
Virtual and Augmented Reality Revenue (VR & AR)
![]()
Oculus is a virtual reality headset focused mainly on gaming. Its future might also be a new way to exercise Facebook’s vision of connecting people together both at work and also at home. Facebook already build a virtual world Facebook Horizon for Quest users, where they can meet each other and also build their own virtual worlds.
Facebook acquired Oculus in 2014 and introduced its first standalone Oculus Quest device in 2018. It followed in 2020 with Oculus Quest 2. The company also sells Oculus Rift that is not a standalone product and works only as an extension of a computer.
With the introduction of Oculus Quest, Oculus adoption started rapidly growing, and in 2019 Facebook sold 1.7 million devices worldwide, giving Oculus a 28% market share in VR devices. That puts Facebook in second place behind Sony, with a 37% market share.
Early numbers from 2020 suggest that Oculus is now in the first spot with a market share of 39%.
In terms of revenue, my rough estimate is that from $2 billion of other income that Facebook reports, more than half of it comes from Oculus hardware. Facebook also gets some cut from software sold on the Oculus platform, but this revenue stream is so far tiny.
It seems that, unlike other public grandstands that Mark Zuckerberg announced and were later followed by Facebook doing the exact opposite, Facebook’s determination to be dominating force in AR and VR future looks real. The company is not only talking about it, but we can see some real progress made.
Facebook is investing a lot of resources into this. We are not talking only about the hardware itself but also about software and services surrounding it, including developers’ tools. Facebook’s vision is to build the whole self-sustaining ecosystem around AR&VR, with Facebook at the center of it.
Of course, we should not expect that Oculus will start making money any time soon. Its revenue might reach billions of dollars quite quickly, but taking into account the Oculus headset’s pricing, this will probably be a low margin or maybe even loss-making product for some time. But in 10 to 15 years, this might be a real business.
Facebook is really focused on AR/VR. It is making progress and investing in it, and the whole thing also fits very well within its mission of connecting people together.
Apart from Oculus Quest, the company is also working on AR glasses together with RayBan.
It looks promising, but we should be aware it is still a high-risk business for Facebook, and it does not have to work out. There are many moving pieces that need to fit together to make this a big success. Facebook is also not the only company pursuing it.
But if it happens and Facebook will be in the center of the VR/AR ecosystem, this can be a shift in tech business comparable to the adoption of smartphones, even though the adoption itself might take a longer time.
Suppose this grand vision of meeting people and working in virtual worlds does not work out that well. In that case, Oculus can be at least Facebook’s way how to get into the gaming business where it can emerge as a strong player competing with other large gaming platforms like PlayStation and Xbox ecosystems.
Portal Devices Revenue
![]()
Portal is a name for a range of devices by Facebook focused on videoconferencing. This hardware is essentially a cheap strip-down tablet with some handy out-of-the-box features that makes videoconferencing more hassle-free and easy.
Estimates are that in 2019 Facebook sold 1 million of these devices, which with an average price of around $100 would mean it earned $0.1bn revenue, which is only a very tiny drop within Facebook revenue and probably loss-making.
Facebook chose to make Portal open to be also used with third-party videoconferencing services apart from Facebook Messenger and WhatsApp. It also includes Amazon’s Alexa voice assistant.
Facebook Shops Revenue
![]()
Facebook Shops is a new service introduced in 2020 that allows small businesses to set up digital shops on Facebook. These shops are simple but allow core features, including payment processing.
Facebook Shops will be accessible through businesses’ profiles across Facebook, Instagram, and later even in Messenger and WhatsApp.
Facebook shops are free to set up, but Facebook will charge a 5% commission from each realized purchase. This commission already includes payment fees. For shipments of $8 and less, Facebook will charge a flat fee of $0.40. However, Facebook announced that it wouldn’t charge this fee during 2020.
The direct revenue contribution of Facebook Shops in 2020 was $0 because Facebook waved the 5% fee. Estimating revenue for 2021 at this moment would be just guesswork. I can say that I expect it to be a noticeable part of non-advertising revenue. Still, overall, I don’t expect significant revenue coming from Facebook Shops directly.
That being said, I still think this is a huge revenue opportunity going forward, just not because of its 5% commission from sales, but rather because of additional advertising revenue Facebook Shops will bring.
Facebook Shops’ strength both for businesses and Facebook is that Facebook Shops are good for user experience. Users won’t be directed outside their app to some external website when they stumble upon some product they like. Everything will happen within the app, and there will also be no need to re-enter your payment information.
This more seamless user experience is expected to lead to higher conversion rates of ads. Higher conversion rates mean that ads that drive traffic to Facebook Shops will become more valuable, which will drive demand up.
Demand for ads is an important driver of price per ad on Facebook. The idea is that this might then drive the price per ad higher and therefore bring more advertising revenue. Far more than 5% commission Facebook will charge sellers.
Also, by offering an easy setup of shops for small businesses that did not have an online presence before, Facebook is essentially gaining new customers that can later decide to run ads to drive traffic to their shops.
I think this is a huge business opportunity for Facebook, and the expectation is that Facebook will not stop here and will continue to enhance Facebook Shops with new features. In the end, Facebook can take a lot of inspiration from China, where social commerce is much more developed.
Payment Fees Revenue
![]()
Facebook earns hundreds of millions USD in net fees from developers that use Facebook’s payment infrastructure.
Several years back, this was the primary source of non-advertising revenue before Facebook started selling hardware.
Just be aware that this is different from Facebook Pay which is a service introduced in 2019 and allows users to send money to each other for free across Facebook’s apps.
Another payment initiative in preparation, where Facebook showed how bad it is when it comes to PR and communication, is a payment initiative called Libra (later renamed to Diem) that was supposed to be a new worldwide currency and digital wallet based on blog-chain technology.
I will not expand here about Libra itself, but allow me just a few comments about the way it was introduced and that in the end, it is not so important for Facebook. For more info about Libra, check Wikipedia, which has a good summary of it.
Libra’s introduction got into the news and caused a big wave among politicians, bankers, and financial regulators. The reason it got so much attention when it was just an introduction of more or less standard digital wallet was that it was introduced by Facebook, a company renowned for many privacy breaches.
Libra’s introduction was also a direct threat to the banking and payment cartel-like industry. Bankers and their regulators obviously were not very welcoming to the idea and managed to scare away most of Libra’s original partners.
One has to truly admire the audacity of Facebook to introduce Libra at a time when it still did not recover from its various data breaches. They did not see the issue in announcing that they would now like to take care also of people’s money and make transaction data secure. That is admirable and terrifying at the same time.
What is even more amazing is that the company and Mark Zuckerberg looked surprised by this adverse reaction. Similar audacity was also the idea to create its own currency covered only from 50% by US dollar, which was rightly seen in the US as quite a controversial decision. It did not seem that Facebook thought it through properly.
All of that happened while Congress was investigating big tech companies’ antitrust practices, including Facebook.
In the end, Facebook continues to push Libra forward under the new name Diem. But Facebook predictably dropped the idea of creating a new single worldwide currency and will create multiple single currency versions. From the users’ perspective, advantages compared to standard Facebook Pay are not so evident, and I see it only as an alternative underlying technology choice. For the Facebook business, it is more important if people will use Google Pay and not so much if it will be based on the standard payment system, Libra/Diem, or a centralized system like India’s UPI.
WhatsApp Revenue
![]()
WhatsApp is one of Facebook’s core apps, together with Facebook App, Instagram, and Messenger. It s the most popular messaging app worldwide with 2 billion users, although in the US, it is in second place after Facebook Messenger.
Facebook purchased WhatsApp in 2014 for $19bn and so far was not able to earn any significant revenue from it.
Apart from eliminating potential competition, the original plan that was in place was to monetize WhatsApp through ads, as they did with Messenger and Instagram. Facebook was working on launching ads and was planning to start slowly and cautiously by introducing ads as part of WhatsApp Status.
In the end, this plan was scrapped in 2020, and the company is trying to find a new way of making money from WhatsApp. The currently pursued strategy is to charge businesses for using WhatsApp to communicate with their customers.
WhatsApp is mainly used as a personal chat app. But many users, mainly in developing nations where WhatsApp has a high market share, use the platform also for commerce and communication with businesses.
Currently, WhatsApp, even without ads, generates small revenue from fees. It charges businesses fees for using its API, which businesses can use to send messages to their customers.
Sending a message is free within 24 hours from the time the customer contacted business through WhatsApp. After this period expires, WhatsApp charges companies between 0.5 to 1 cent per message.
Facebook said that around 175 million people reach out every day to businesses using WhatsApp, but most of the interactions will probably be within a 24-hour window. The resulting revenue from messages after 24 hours is small, and my rough estimate puts it around $100 million. Given the market position of WhatsApp, hardly anything close to what its potential is.
Facebook is not stopping here and announced plans to host messages for companies. Facebook also acquired company Kustomer, which fits this strategy well.
Acquisition of Kustomer suggests that the company is taking a more holistic approach and will introduce business messaging services and tools available across all Facebook messaging apps, including WhatsApp, Messenger, and Instagram.
This might provide good service for businesses and allow their customer to reach them from whatever Facebook messaging app they prefer. And since Facebook owns the top messaging platforms worldwide, it means they can reach most customers this way.
Even with all these activities combined, it is hard to imagine future revenue generated by WhatsApp higher than the low billions of USD.
That does not mean that the WhatsApp acquisition did not make business sense for Facebook. It clearly did. Just the fact that by this, Facebook eliminated a competing platform and strengthened its position in messaging was worth it. Facebook at the time was aware that WhatsApp is big enough that it could potentially start introducing social network features and become Facebook’s competitor in the future.
This internal reasoning for acquisition as a way to eliminate emerging competitor is well documented by internal emails featuring Mark Zuckerberg that were made public. The acquisition of WhatsApp is at the center of a looming antitrust lawsuit against Facebook.
Workplace Revenue
Workplace is a communication tool by Facebook to be used internally by companies. The main selling point for companies is that it offers a familiar user experience since most people are used to it from their personal Facebook.
Within Workplace, users can use Groups, Chats, Rooms, and Live video features similar to their personal Facebook apps. Similarity to Facebook app eliminates the learning curve and helps with adoption.
The obvious issue here is the Facebook image in terms of privacy and security, which might deter many companies from Facebook’s business services. What Facebook can offer is its user-friendly technology for internal business communication that is being used by billions of users daily.
The company claims that Workplace has 5 million paying subscribers and charges them $4 to 8$ a month per person before discounts. Assuming the average price after discounts is $4, that would mean annual revenue in 0.2bn in 2020.
So far tiny part of Facebook but definitely the one to watch. Users grew quite quickly through the COVID-19 pandemic from 3m to 5m users.
“Other” Other Revenue
I described above the most relevant parts of non-advertising revenue. We could also find other services or products that bring some very tiny revenue in, but they are irrelevant when we compare it with Facebook’s revenue of $86bn in 2020.
Some of them are even nearly unknown. For example, as Facebook builds many fiber networks connecting its data centers, it sells excess capacity in its fiber network through its subsidiary Middle Mile.
🔴 Breakdown & Analysis of Facebook’s Expenses (Income Statement)
Despite COVID-19, Facebook continued its hiring spree in 2020, increasing its employee count by 30% to 59 604. Facebook also continued its investment in data center capacity and related technical infrastructure.
Facebook’s overall expenses grew 14% to $53bn in 2020. However, this 14% growth results from comparing 2020 expenses to the extraordinary year 2019 when Facebook booked a $5bn FTC penalty as an expense and another $0.55bn of settlement expenses.
If we disregard 2019 one-offs, Facebook expense growth would be 36% in 2020, which is far more than 22% growth in revenue. This expense growth was driven mainly by continued growth in the number of employees (+30%) and investments in Facebook’s data centers and technical infrastructure.
The biggest piece of Facebook’s overall expenses are employee-related expenses. This includes salaries, benefits, and share-based compensation for nearly 60 000 employees.
The majority of Facebook employees work in engineering and technical roles, so it should be no surprise that research and development is the biggest Facebook expense item in its income statement. Research and development represent 35% of expenses.
Another important expense item, which is growing quickly in the last couple of years, is the cost of revenue. Its growth is driven by investments in data centers and other technical infrastructure that Facebook needs to serve its 3.3bn users worldwide.
Cost of revenue and research and development expenses are not only the biggest expense categories for Facebook, but they are also the fastest-growing ones. These items are growing far more quickly than Facebook revenue. The only expense item growing more rapidly is advertising expenses, but its contribution to total expense growth is not material thanks to its smaller total size.
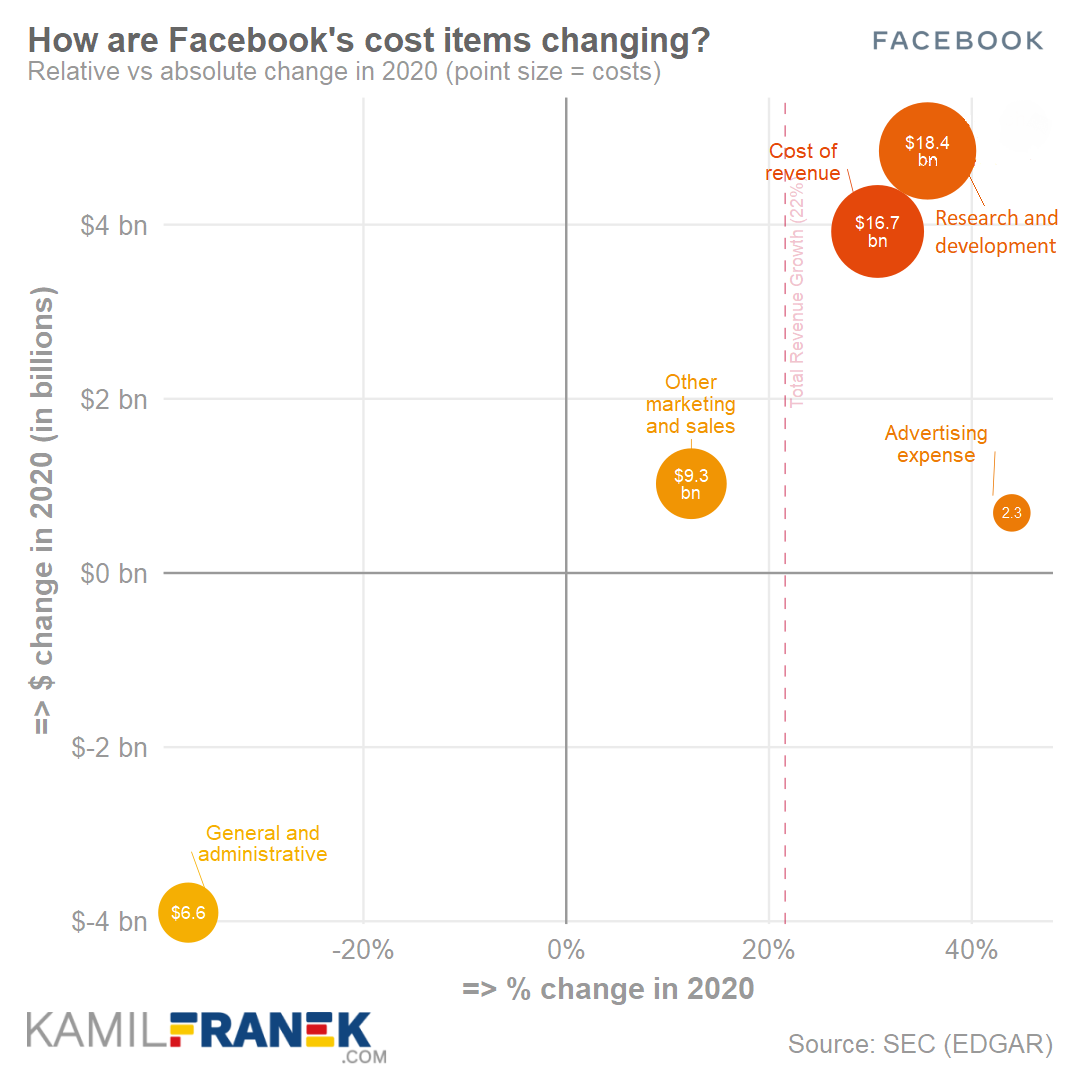
The main theme of Facebook expense growth is that for several years now, expense growth significantly outpaced revenue growth, which is driving Facebook’s margin down.
Facebook expects its operating margin to decrease going forward. It expects a slow down in revenue growth and continuation of high expense growth. Facebook announced that they expect total expenses in 2021 to be in the range of $68-73 billion. That would mean 28% to 37% expense growth in 2021 and a decrease in operating margin.
Facebook’s operating margin was 38% in 2020, which is extraordinary for a company of Facebook’s size. Thanks to its high operating margin, Facebook has some wiggle room to continue with this revenue and expenses growth mismatch.
However, if this mismatch continues for the next two years, the Facebook operating margin will drop close to 30%. If it continues for four years, Facebook’s absolute operating income will start to decrease.
Facebook claims that a big part of these expenses are investments in its AR/VR capabilities expected to drive revenue growth going forward. In that case, it might make perfect sense to invest now, even if it would mean a temporary decrease in operating income.
Cost of Revenue
![]()
Facebook’s cost of revenue grew by 31% to $17bn in 2020, outpacing revenue growth. The main factors driving this growth were expenses related to data centers and technical infrastructure and also higher costs associated with partner arrangements which contain traffic and content acquisition costs.
The smaller driver was also an increase in costs of consumer hardware sold that was connected with Facebook’s increased sales of its Oculus and Portal devices.
So we know that data centers and partnership agreements were the main drivers of growth of cost of revenue. Now, let’s look at what exactly is part of this $17bn cost item called cost of revenue.
There are several main cost categories included in Facebook’s cost of revenue:
- operation of Facebooks data centers and technical infrastructure
- costs associated with partner arrangements (traffic acquisition and content costs)
- credit card and other transaction fees related to processing customer transactions
- cost of consumer hardware devices sold
Expenses from Facebook’s income statement related to the operation of data centers and technical infrastructure are the biggest piece of the cost of revenue. It includes not only data centers facility and server equipment depreciation, but also salaries, benefits, and share-based compensation for employees on Facebook operations teams and also energy and bandwidth costs related to data centers.
Other components of cost of revenue are traffic acquisition and content costs. Content costs are mainly related to payments to video and music content providers. Since 2017, Facebook has started to invest a lot into original shows and other video content made available as part of the Facebook Watch tab.
Based on some reports, the budget for 2020 was $1.4bn compared to the 2017 budget of 1bn. This is not an official number, but it can give us an idea of these expenses’ scale. It looks that content costs continue to grow in time, but lately, less of it goes towards original scripted shows, and Facebook is reportedly more focusing on talks shows and short TV and sports clips.
Another item that is part of Facebook’s cost of revenue are traffic acquisition costs. Currently, I cannot give you more details of what precisely these expenses are connected to.
Facebook may have some revenue-sharing agreement with hardware manufacturers about preinstalling Facebook services, similar to what Google does, but this is just a guess. I have not seen any document or report that would shed some more light on it.
Another minor component of the cost of revenue are credit card and other transaction fees related to processing customer transactions. These costs are about the fees Facebook incurs when it accepts payment from its advertisers or facilitates payments between its users.
The last and smaller item that is part of the cost of revenue are the costs of consumer hardware that Facebook sells.
Hardware is something Facebook is far more active recently as it launched Oculus Quest in 2019 and Oculus Quest 2 a year later. To a lesser extent, costs also increased thanks to the introduction of a range of different Portal devices designed primarily for videoconferencing.
The hardware business is probably not profitable right now for Facebook, and it is not going to change any time soon. But hardware share on both expenses and revenue will increase going forward as Facebook made clear that AR/VR dominance is one of its priorities, and the company, apart from continuing to push Oculus hardware, also announced that they are working on AR glasses in cooperation with Ray-Ban.
Research & Development Expenses
![]()
Facebook spend $18bn on research & development in 2020, 36% more than the previous year. These expenses represent mainly compensation for employees working on new products or improving existing ones. Growth of R&D expenses by 36% in 2020 was driven by a 40% increase in employees in R&D.
Research and development expenses are the biggest Facebook’s expense item and are growing faster than total expenses. R&D expenses include mainly salaries, benefits, share-based compensation, and also facility-related expenses for employees that work on engineering and technical teams.
Research and development employees made the majority of 58 604 employees that worked at Facebook at the end of 2020.
These include employees working on improving existing Facebook products and adding new features and employees working on future-focused projects that are not yet fully developed and monetized. An example of such a project is Facebook’s virtual and augmented reality hardware and services.
It is important to note that Facebook expenses all research and development costs as they are incurred. Development costs that meet the criteria for capitalization were not material.
Since Facebook plans to continue recruiting software engineers and other technical employees, this growth is expected to continue in 2021. In 2020 growth of R&D employees was 40%, compared to the overall employee headcount growth of 30%.
Marketing and Sales Expenses
![]()
Facebook’s marketing and sales expenses grew by $1.7bn (+17%) in 2020 to $12bn. This growth was much slower than the previous year and also much slower than revenue growth. Included in these expenses is also $2.3bn of advertising expenses that, considered separately, were growing by 44%.
Facebook did not outright state this year what the main driver of 44% advertising expense increases was. It was most probably driven by campaigns focused on Facebook’s hardware products like Oculus and Portal. At least, this was the reason behind the 2019 advertising expense growth.
Marketing expenses were the main driver behind the $1.7bn expense increase, which includes advertising expenses.
Another driver was a 16% increase in employee headcount in marketing and sales functions which increased payroll and benefit expenses. This increase was partially offset by a decrease in travel-related expenses influenced by the COVID-19 pandemic.
Growth of headcount in marketing and sales function by 16% was much slower than the previous year and much slower than in any other expense category. It was the only expense category of Facebook with lower growth than 22% revenue growth.
Having mentioned the biggest driver of marketing and sales expenses change in 2020, let’s now look at the main parts of this $12bn expense category.
The main parts of $12bn of marketing and sales expenses in 2020 were:
- salaries, benefits, share-based compensation for employees working in sales, sales support, marketing, business development, and customer services functions.
- marketing and promotional expenditures (advertising expense was $2.3bn)
- professional services such as expenses related to content reviewers that Facebook hires through subcontractors.
Most of the items above are self-describing. It is obvious that marketing and sales expenses include sales and marketing stuff.
It is not obvious that marketing and sales expenses also include expenses related to content reviewers. They are not the main part of these expenses, and they were not an important driver of overall marketing and sales expenses increase in 2020.
However, in 2019 and also 2018, community operation, which is a term that Facebook often uses for content moderation, was a growth driver important enough that Facebook mentioned it in its financial statement comments.
Content reviewers are an important part of the Facebook content moderation approach. It is true that Facebook heavily relies on its algorithms to take down as much “bad” content as possible before anyone sees it, but content reviewers are a very important part of the mix.
They take down content that algorithms cannot decisively categorize themselves as content violating Facebook’s rules or where content gets flagged by users.
Content reviewers are also an important way how Facebook’s algorithms learn what they should look for.
As Facebook scaled up its content moderation attempts, the number of content reviewers grew from 4,500 in 2017 to 15,000 in 2018. Given the fact that the number of people working on safety and security grew from 30,000 to 35,000 in 2020, and if it still holds that half of those people are content reviewers, we are talking about 17,500 people in 2019 working on content moderation.
The company did not offer any update since 2019, so my assumption is that number of content reviewers stayed flat compared to 2019, when it was around 17,500. It also explains why content moderation was not mentioned as an expense growth driver, which might be connected with COVID-19 as Facebook was forced to rely more heavily on algorithms.
17,500 content reviewers are not employees of Facebook. The majority of them are working through subcontractors. In 2020 Facebook announced that it is shifting most of the people working on moderation of the most sensitive type of content to full-time employees. This change was done amid worries that for contractors working from home during the COVID-19 pandemic, it would be challenging to enforce that they get appropriate mental health support.
The unfortunate fact about content moderation is that although it might not be a highly demanding job when it comes to technical skills, people who are moderating more sensitive stuff have an exceptionally mentally challenging job.
If you are interested to know more, you can check out this documentary by Verge about the life of content moderators in one of Facebook subcontractors.
General and Administrative Expenses
![]()
Facebook’s general and administrative expenses significantly decreased by $3.9bn in 2020, from $10.5bn in 2019 to $6.6bn in 2020. However, the only reason why these expenses decreased is that in 2019 they included an extraordinary $5bn FTC penalty and also other booked settlements of $0.55bn.
When we adjust the numbers for these extraordinary items, then general and administrative expenses grew by 36%, which is more than revenue growth.
This growth’s main drivers were mainly professional services and higher payroll and benefits expenses connected with 23% growth in headcount in general and administrative functions.
Unfortunately, I don’t currently have more detail about what professional services drive this expense category up. It should not be legal services since Facebook separates legal-related costs into a different category.
The $0.55bn settlement was related to a case claiming that Facebook facial recognition features violated the Illinois Biometric Information Privacy Act. This amount was in 2020 finalized and increased to $0.650.
General and administrative expenses include everything that did not fit in any other expense category. It consists of the following expenses:
- legal-related costs
- salaries and benefits, and share-based compensation for certain of Facebook’s executives
- salaries and benefits, and share-based compensation for legal, finance, human resources, corporate communications and policy, and other administrative employees
- professional services
If you want to know more about the reasons behind the $5bn FTC penalty, you can check it out directly in the FTC press release. This penalty did not come out of the blue, but it was the result of repeated systemic privacy failures on Facebook’s side.
Back in 2012, Facebook reached a settlement with FTC about its privacy failures at that time. FTC charged Facebook that “Facebook deceived consumers by telling them they could keep their information on Facebook private, and then repeatedly allowing it to be shared and made public.”
At the time, FTC just wagged a finger at Facebook, and there was no monetary penalty attached. The settlement required Facebook to live up to its own promises about privacy and security, especially obtaining consent from consumers before sharing their information beyond their privacy settings.
Facebook did not live up to those promises, and after the Cambridge Analytica scandal, FTC launched another investigation that culminated in a $5bn penalty and another settlement order.
Expenses as % of Revenue and Operating Margin Development
Facebook’s operating margin was 38% in 2020, which was an improvement compared to the 34% margin in 2019. However, the lower margin in 2019 was caused by an extraordinary $5bn FTC penalty for Facebook privacy breaches. The overall trend over the years is that Facebook’s operating margin is gradually decreasing.
You can see this trend in the chart below, which shows expenses as % of revenue, and the empty white area below 100% line represents the revenue not spend on expenses, which is, in other words, operating margin.
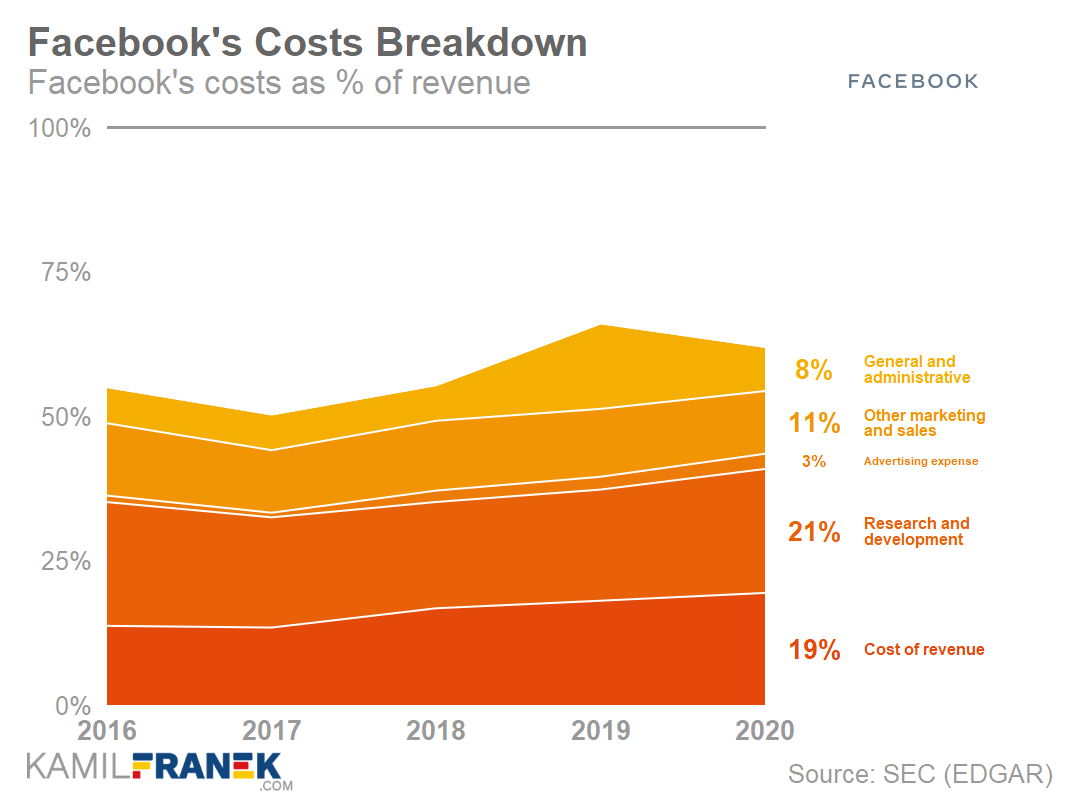
Decreasing margin is caused by a continued discrepancy between revenue growth and growth of expenses within Facebook’s income statement. Facebook revenue for the last couple of years was growing slower than expenses (if adjusted for FTC penalty), and also revenue growth is gradually decreasing.
What is more, company expectation is that this will continue. So we can expect that decrease in the operating margin will continue as Facebook continues to invest in its projects like augmented and virtual reality. Those expenses are booked when they are incurred, and so it will hit profits right away.
High expense growth by itself should not be an issue if those expenses go against investments that will earn sufficient profits in the future. But if this discrepancy will continue for a longer time, we need to be prepared that Facebook profitability will get hit by it until those investments start to make money, which is highly uncertain.
The current 38% margin is respectable for a company of the Facebook size, and therefore Facebook has some breathing room before the growth discrepancy will cause Facebook profits to decrease. If this mismatch continues for the next two years, the operating margin will drop to around 30%, and after four years, even absolute operating income will start to decrease.
💵 Breakdown and Analysis of Facebook’s Cash Flow Statement
Facebook generated $38.7bn of operating cash flow in 2020 which was an increase of 7% versus the previous year. Results would be even better, but cash outflow in 2020 included a $5bn FTC penalty. The standard free cash flow was $23.6bn, which was an 11% increase.
The issue is that given Facebook’s significant use of lease financing, especially in 2019, the standard definition of free cash flow is not very helpful and misrepresents reality. If we adjust 2020 free cash flow for operating lease financing and stock-based compensation, we will arrive at a free cash flow of 16.7bn which was a significant increase compared to $11.7bn in 2019.
The jump in adjusted free cash flow was driven mainly by Facebook investing less through lease financing in 2020 than in 2019.
Looking at Facebook’s cash flow statement is essential for better insight into how the company spends cash that it generates.
Facebook generated $39bn of operating cash flow in 2020, and after a deduction of $15.1bn of investment in property and equipment, we arrive at $23.6bn of free cash flow.
Investments of $15.1bn into property and equipment were mostly investment into Facebook’s own data centers and networking equipment, and it was the same number as the year earlier. But this was not what Facebook originally planned for 2020. Facebook originally planned to invest $17-$19bn but had to reevaluate it due to pandemic-related shelter-in-place orders.
Going forward, Facebook is clear about its plans to continue to invest heavily, as we know from their announcements. Therefore, we should not be expecting any dramatic free cash flow increases.
Facebook’s own guidance about 2021 capital expenditures from its annual report is that they will invest between $21bn and $23bn. This should be driven by data center capacity, servers, network infrastructure, and office facilities.
After deduction of capital expenditures, we arrive at $23.6bn of free cash flow. Let’s now focus on only the most important items in the cash flow statement and see how Facebook used $23.6bn of free cash flow it generated in 2020:
-
Facebook bought $6.4bn of equity investments. Most of it ($5.8bn) was the purchase of a 9.99% stake in Jio Platform Limited. This company brought fast and cheap internet to hundreds of millions of Indians and is currently the top mobile data provider in India.
There are plans for cooperation between Facebook and Jio on e-commerce offers for Indian small businesses, but currently, not too many details about this cooperation were made publicly available. Facebook was no the only big tech investor in Jio, though. Google purchased a stake too.
- Facebook returned $6.3bn cashback to its investors through buying back their own stocks. This is not a particularly big number and is just enough to offset $6.5bn of stock-based compensation that would otherwise have a diluting effect on current shareholders.
- Apart from some other smaller items, the rest of the free cash flow was used to increase the Facebook cash pile to $62bn.
⚖️ Breakdown and Analysis of Facebook’s Balance Sheet
Although Facebook might look like a service provider that is asset light, just a quick look at its balance will show that it is not only about software and services but also about a lot of infrastructure since Facebook uses its own data centers. One data center cost billions of dollars to build and equip and Facebook at the end of 2020 had 17 of them worldwide.
Facebook also heavily invested in fiber optic routes to move data traffic between its data centers, including both undersea cables and land routes.
Facebook balance sheet increased by $26bn to $159bn in 2020. The main changes in assets were a $10.3bn increase in property and equipment, a $7.1bn increase in Facebook’s “cash pile,” and also $6.1 increase in equity investments.
An increase of $10.3bn of property and equipment was driven by purchases of buildings and investment in networking equipment. Buildings included both data centers also increase in office space.
A lot of large tech companies now usually buy office buildings compared to just renting them. For giants like Facebook, it makes perfect sense since property prices typically increase in value when a tech giant decides to enter a certain area.
Facebook’s headquarters have around 10 million square feet of office space, and it also has other offices in 80 cities around the world.
The second driver of asset increase was a $7.1bn increase in cash and cash equivalents, which is usually addressed as Facebook’s “cash pile.” As is usual for technology companies, cash and cash equivalents have a high share of total assets. In Facebook’s case, its cash pile represented 39% of the assets in 2020.
The last important driver of asset growth was an increase in equity investments, which was mainly about the purchase of a 9.99% share in Jio, which I already commented on earlier.
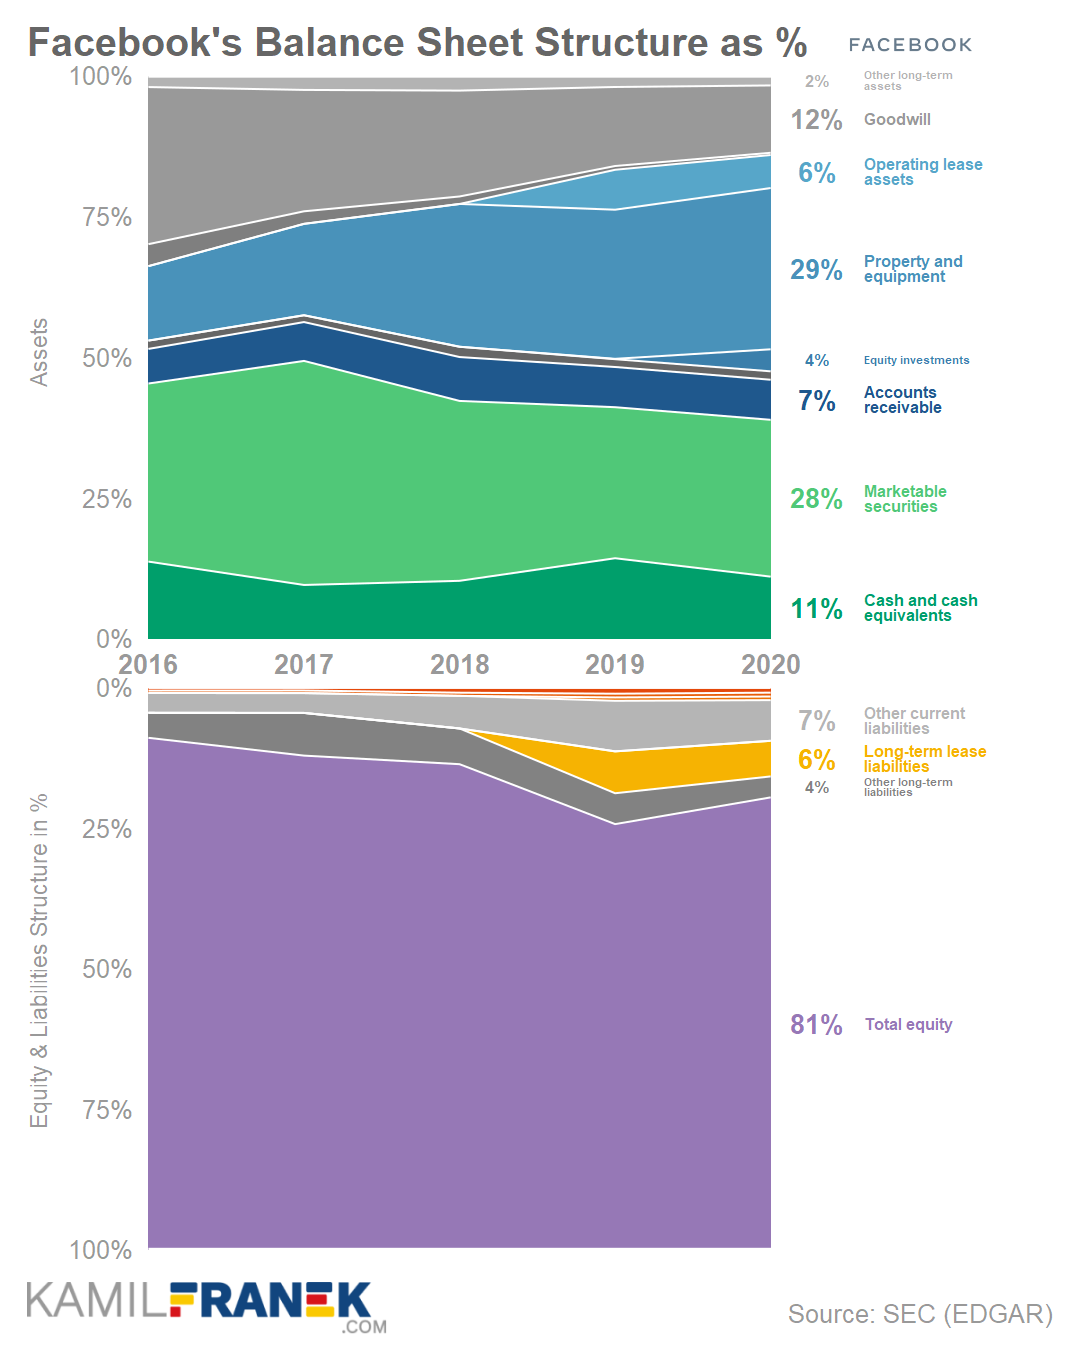
In terms of the equity & liabilities side of the balance sheet, you can see from the chart above that it is quite simple, and Facebook is financed predominantly by equity. It has nearly no debt except lease liabilities and short-term payables. That is very unusual and might be suboptimal going forward. Taking on some low-interest long-term debt might be a good play for shareholders.
📚 Resources & Links
Related articles
- How Facebook Makes Money: Business Model Explained
- Who Owns Meta(Facebook): The Largest Shareholders Overview
- Overview of who owns Meta Platforms and who controls it. With a list of the largest shareholders and how much is each of their stake worth.
- 7 Best Charts for Income Statement Presentation & Analysis
- Microsoft Financial Statement: Overview & Analysis
Official Facebook’s Annual Reports (K-10)
- Facebook’s Annual Report 2020 (10-K)
- Facebook’s Annual Report 2019 (10-K)
- Facebook’s Annual Report 2018 (10-K)
Other Resources
- Facebook’s Investor Relation website
- Facebook’s Press Releases
- Digital 2021: Global Overview Report
- Socialbakers: Social Media Trends Report Q4
- Socialbankers Webinar: The Social Media Trends You Need to Know
Technical Notes & Disclaimers
- Although I use third-party trademarks and logos in this article and its visuals, kamilfranek.com is an independent site. There is no relationship, sponsorship, or endorsement between this site and the owners of those trademarks.
- At the time of writing this article, I had a long position in Facebook.