
Microsoft’s Financial Statements: Overview & Analysis 2022
Microsoft (MSFT) had another successful year in 2022, despite a slowdown in the last quarter of its fiscal year. Microsoft’s financial statements show that Microsoft continued to increase its profits and returned a hefty amount of cash to investors. It also invested in its data center infrastructure, hired a record number of people, and closed the Nuance acquisition.
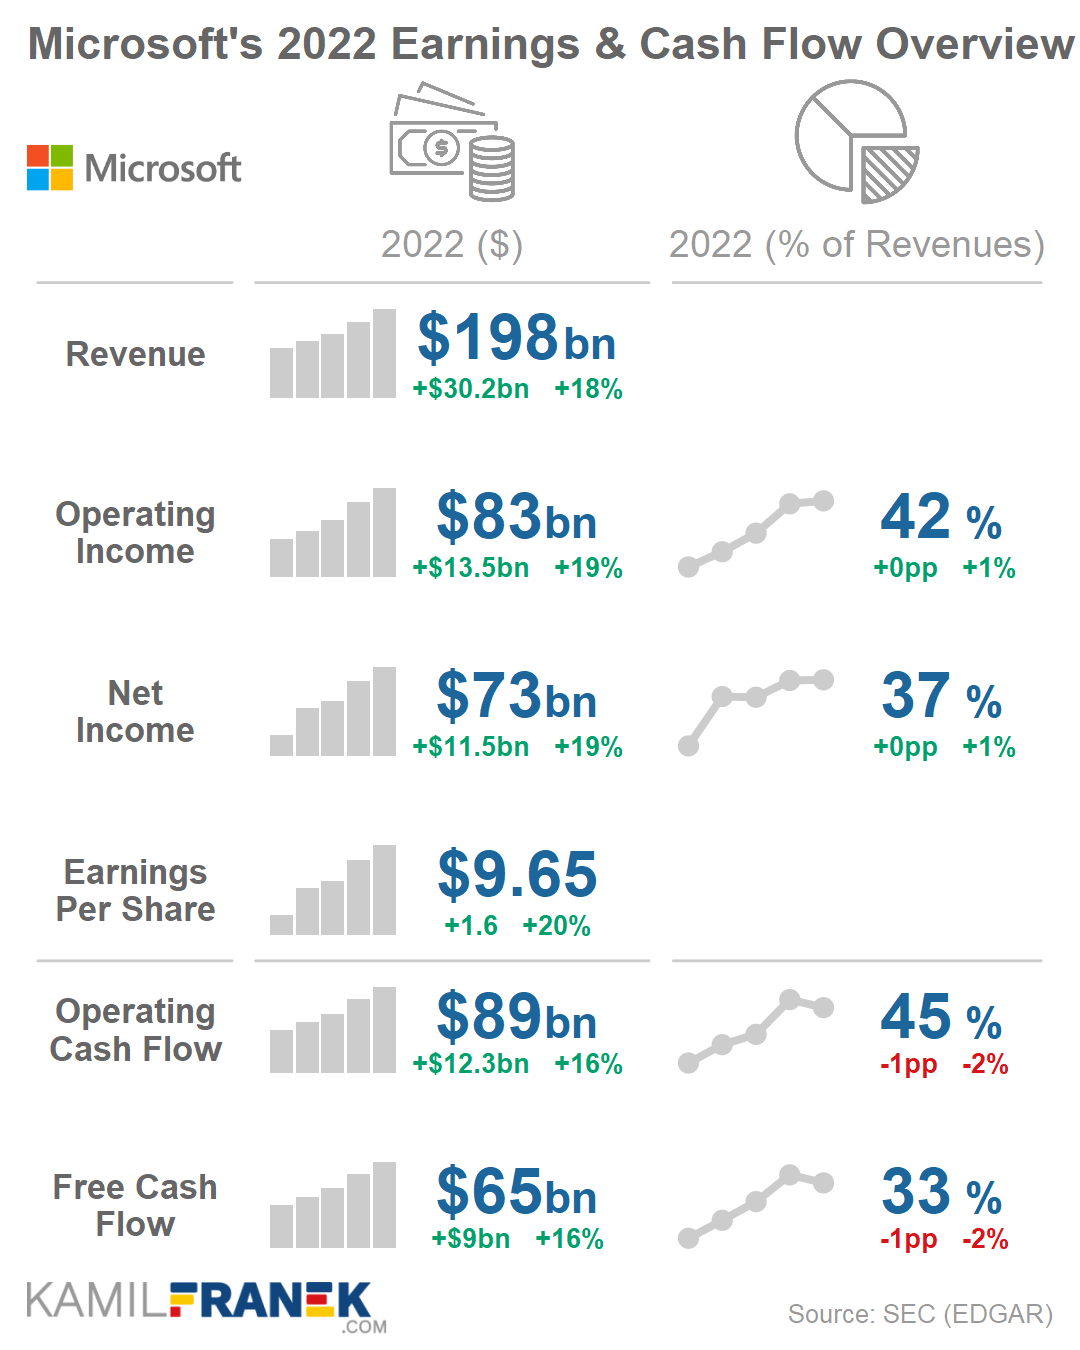
Microsoft earned $72.7 billion of net income in 2022 (+19% growth) from revenue of $198 billion (+18%). Operating margin was stable at 42%. Microsoft generated $89bn of operating cash flow (+16%) and increased payout to investors by 16% to $50.8bn. Its balance sheet grew by 9% to $365bn.
In this article, I will walk you through Microsoft’s financial statements from its annual reports that I analyzed. I will explain what is going on in each of them and offer you visuals, charts, key takeaways, and drivers behind the numbers.
If you are new to my posts about companies’ financial statements and the visualizations I use, I published a post “7 Best Charts for Income Statement Presentation & Analysis”. In this post, I explain most of the financial statement visualizations I use here.
If you want to go deeper than financial statements and understand how Microsoft makes money and its business model works, I recommend my other article “How Does Microsoft Make Money: Business Model Explained”.
Or you can find out Who Owns Microsoft and who controls is.
📒 Microsoft Income Statement (Profit & Loss) Overview & Analysis (2022)
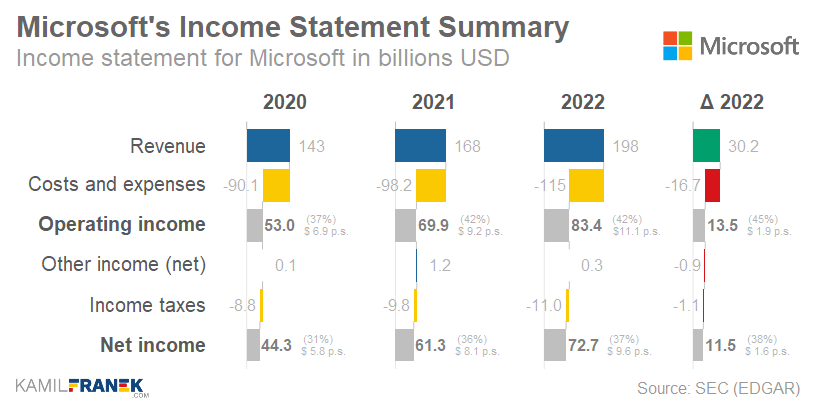
Microsoft earned $72.7 billion of net income in 2022, up $11.5bn (+19%) from a year earlier. This huge amount of profit and expectation of its further growth in the future is the reason why Microsoft is one of the most valuable companies in the world.
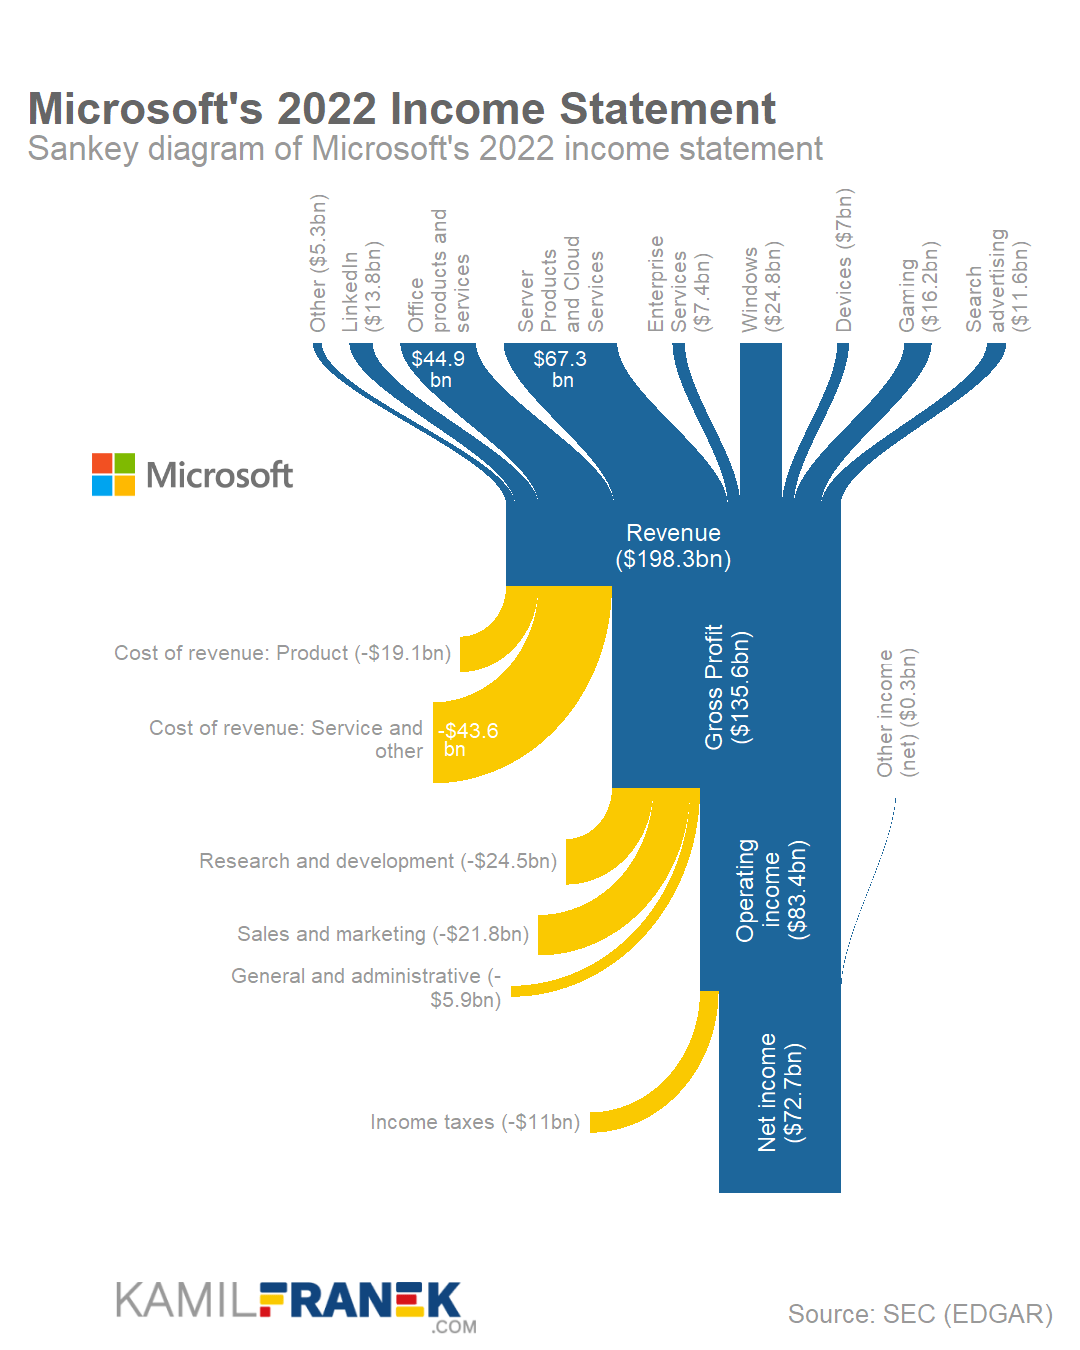
Microsoft’s revenue in 2022 was $198 billion , up $30.2bn (+18%) from a year earlier. Microsoft’s largest revenue sources were Office with $44.9bn of revenue and Azure cloud services with $44bn of revenue.
Microsoft’s Operating income was $83.4 billion in 2022, up $13.5bn (+19%) from a year earlier. Operating income as % of revenue (margin) was 42%, similar to the previous year.
Before I walk you through the analysis of Revenue, Expenses, and Operating Income from Microsoft’s annual reports and the drivers behind them, let me show you different visualizations of overall Microsoft’s Income Statement (Profit & Loss).
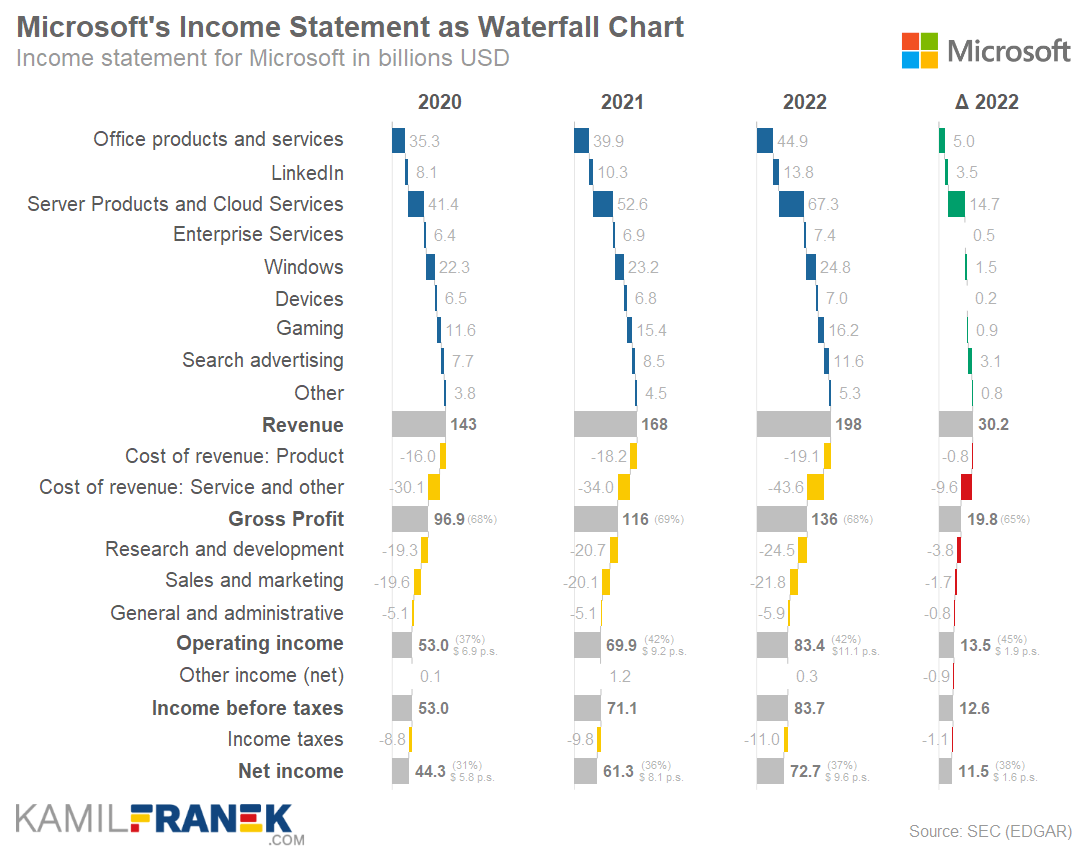
Microsoft’s Income (Profit & Loss) Statement
| 2020 | 2021 | 2022 | Δ | %Δ | |
|---|---|---|---|---|---|
| Office products and services | 35.3 | 39.9 | 44.9 | +5.0 | +13% |
| 8.1 | 10.3 | 13.8 | +3.5 | +34% | |
| Server Products and Cloud Services | 41.4 | 52.6 | 67.3 | +14.7 | +28% |
| Enterprise Services | 6.4 | 6.9 | 7.4 | +0.5 | +7% |
| Windows | 22.3 | 23.2 | 24.8 | +1.5 | +7% |
| Devices | 6.5 | 6.8 | 7.0 | +0.2 | +3% |
| Gaming | 11.6 | 15.4 | 16.2 | +0.9 | +6% |
| Search advertising | 7.7 | 8.5 | 11.6 | +3.1 | +36% |
| Other | 3.8 | 4.5 | 5.3 | +0.8 | +18% |
| Revenue | 143.0 | 168.1 | 198.3 | +30.2 | +18% |
| Cost of revenue: Product | -16.0 | -18.2 | -19.1 | -0.8 | +5% |
| Cost of revenue: Service and other | -30.1 | -34.0 | -43.6 | -9.6 | +28% |
| Gross Profit | 96.9 | 115.9 | 135.6 | +19.8 | +17% |
| Research and development | -19.3 | -20.7 | -24.5 | -3.8 | +18% |
| Sales and marketing | -19.6 | -20.1 | -21.8 | -1.7 | +8% |
| General and administrative | -5.1 | -5.1 | -5.9 | -0.8 | +16% |
| Impairment, integration, and restructuring | - | - | - | ||
| Operating income | 53.0 | 69.9 | 83.4 | +13.5 | +19% |
| Other income (net) | 0.1 | 1.2 | 0.3 | -0.9 | -72% |
| Income before taxes | 53.0 | 71.1 | 83.7 | +12.6 | +18% |
| Income taxes | -8.8 | -9.8 | -11.0 | -1.1 | +12% |
| Net income | 44.3 | 61.3 | 72.7 | +11.5 | +19% |
🔵 Microsoft’s Revenue Overview & Analysis (2022)
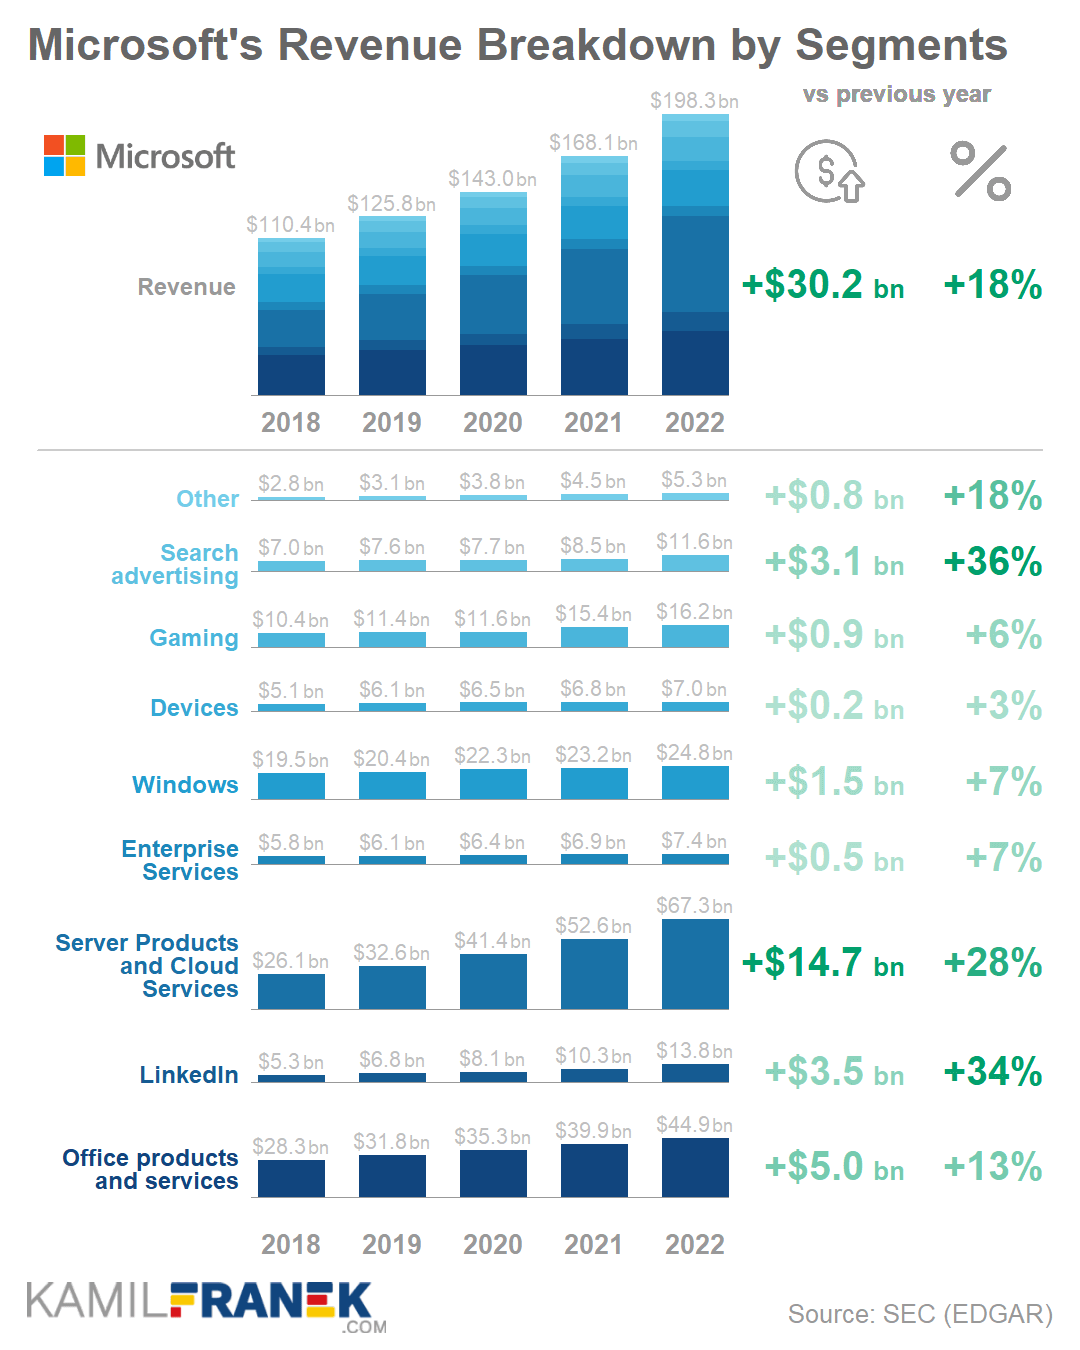
Microsoft revenue in 2022 was $198 billion, up $30.2bn (+18%) from a year earlier. Microsoft’s largest revenue sources were Office with $44.9bn revenue and Azure cloud services with $44 billion.
🔵 How Microsoft generates $198 billion of revenue annually?
The primary sources of $198 billion of Microsoft’s revenue were Office products and services (23% of total revenue), Azure & Other Cloud Services (22% of revenue), Windows (12%), and Server Products (12%).
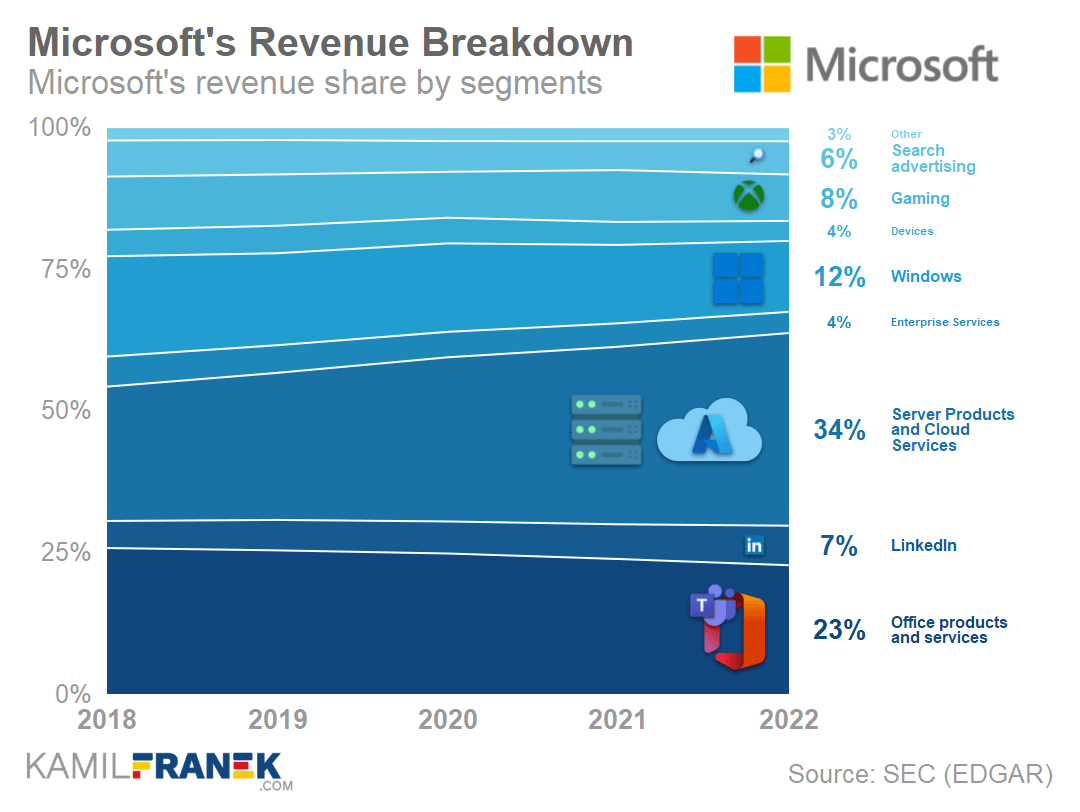
The Office is Microsoft’s most significant revenue source and generated $44.9 billion in 2022, up $5bn (+13%) compared to the previous year.
- Most of Office revenue comes from Office 365 subscriptions that combine online and offline productivity tools. Historically, Office revenue was mostly about selling licenses of Office desktop products. Nowadays, it is nearly all about subscriptions.
- Only a tiny part of Office revenue comes from consumers. Paid Office is offered both for businesses and consumers, but when it comes to revenue, around 86% of it comes from business customers.
- Microsoft had nearly 350 million paid Office 365 Commercial seats. On top of that, it had another 60 million consumer Microsoft 365 subscriptions.
- Office was historically consistently earning a large piece of Microsoft revenue, and it continues to do so.
Azure cloud services are Microsoft’s second-biggest revenue stream, earning $44 billion in 2022, up $13.5 billion (+45%) from a year earlier.
- Azure is poised to replace Office next year as Microsoft’s largest revenue contributor. It is hard to imagine a different situation given its fast growth.
- Azure was introduced more than a decade ago when Steve Ballmer was a CEO, and then under Satya Nadella, Azure became the backbone of Microsoft.
- Azure is the literal backbone of Microsoft as it generates large revenue from Microsoft customers and is also used as an infrastructure for other Microsoft’s cloud-based products.
Windows generated $24.8 billion of revenue in 2022, up $1.5 billion (+7%) compared to the previous year. It was Microsoft’s third-biggest revenue stream.
- Windows is the product that we often associate with Microsoft.
- When you look at revenue, Windows does not look like an important piece of Microsoft anymore. It is currently generating “only” 12% of Microsoft’s revenue.
- However, Windows is still a crucial part of Microsoft’s business. It is an important ecosystem that generates revenue for Microsoft through associated products like Windows Server, Bing Search advertising, and developer tools.
- The biggest piece of Windows revenue ($14.6bn) is coming from equipment manufacturers (OEMs). Revenue from direct license sales to customers is lower ($6.7bn).
Server products revenue was $23.7 billion in 2022, up $1.2 billion (+5%) from a year earlier. Microsoft reports it together with Azure cloud services as “Server Products & Cloud Services.”
- It represents mainly revenue from Windows Server and Microsoft SQL Server products. This revenue stream also includes revenue from developer tools like Visual Studio, some Nuance products, and also GitHub.
It is worth also mentioning Gaming, LinkedIn, and Search. They each generate over $10 billion of revenue annually and represent areas of potential revenue growth in the future.
Gaming generated $16.2 billion in revenue in 2022, which was 8% of total revenue.
- Gaming share on revenue decreased slightly compared to 2022 since gaming revenue growth slowed down significantly compared to the 2021 fiscal year. The year 2021 was influenced by the pandemic and the new consoles launch.
- Gaming revenue will probably jump from $16.2 billion to around $25 billion next year or the year after. This jump could happen thanks to the recently announced acquisition of Activision Blizzard. However, it depends on a green light from regulators worldwide.
Search earns $11.6 billion in revenue for Microsoft and would earn around $25 billion more if Microsoft fixes its Edge/Bing products.
- Microsoft currently earns $11.6 billion from search advertising (6% of total revenue). However, this number could be significantly higher if Microsoft was not losing, according to my estimates, around $25 billion of advertising revenue to Google.
- The problem behind this $25 billion revenue hole is the Edge web browser and its low penetration among Windows users. This is clearly a total failure by Microsoft, and it is surprising that it doesn’t get more attention. I might expand on this issue more in a future article.
LinkedIn generated $13.8 billion of revenue in 2022, up $3.5 billion (+34%) from a year earlier.
- Microsoft acquired LinkedIn in 2016 for $26 billion, and it was Microsoft’s biggest acquisition at the time.
- LinkedIn is earning revenue mainly by helping companies hire people and from advertising.
- At the time, the LinkedIn acquisition was seen as surprising and questionable. It did not help that Microsoft defended this acquisition with a list of synergies . Some looked as if they were made up a few moments before the announcement. One crucial argument missing from the presentation was that if Microsoft buys LinkedIn, Salesforce could not.
- LinkedIn data are also an essential part of Microsoft’s Dynamics 365 products. Integrating LinkedIn Sales Navigator into Dynamics was one of the original acquisition arguments that Microsoft quickly realized. However, the size of this opportunity will hardly justify the LinkedIn acquisition by itself.
- LinkedIn might become one crucial piece of Microsoft’s strategy toward “human resources” focused products and services, including training, hiring, employee feedback, and others.
🔵 Why did Microsoft’s revenue increase by $30.2 billion (+18%) in 2022?
Microsoft’s revenue increased by $30.2 billion (+18%) to $198 billion in 2022. The biggest driver of revenue growth was Azure, which was up by $13.5bn (+45%). Other significant growth drivers were Office products and services (+$5bn), LinkedIn (+$3.5bn), and Search advertising (+$3.1bn).
The overall growth rate of many revenue streams in the 2022 fiscal year looks good compared to the significant slowdown in advertising and PC sales. However, this slowdown influenced full-year results in Microsoft’s profit & loss statement only in one quarter because Microsoft’s fiscal year 2022 ended in June 2022.
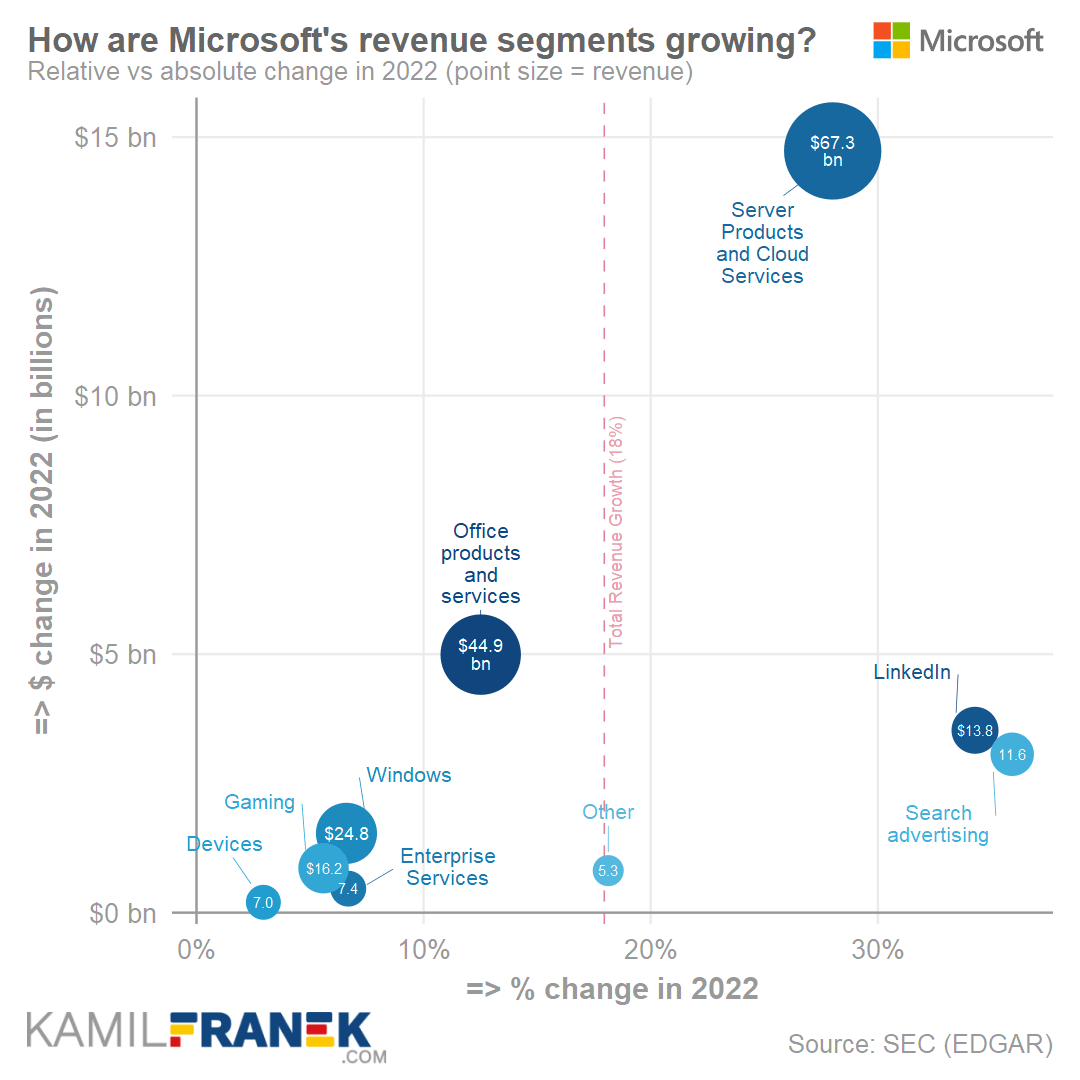
Azure revenue grew by $13.5bn (+45%) to around $44 billion in 2022. Azure is the single most important growth driver of Microsoft’s revenue and was for years. Thanks to its fast growth and size increase, it will continue to be a core driver for years to come.
- The driver of increased Azure revenue is the increased consumption of Azure resources by Microsoft’s customers.
Microsoft Office revenue grew by $5 billion (+13%) to 44.9 billion in 2022. Office was Microsoft’s second-largest revenue growth driver in 2022.
- Office revenue growth of 13% might not look impressive, but it is. It is far below Azure growth rates, but for a matured business like Office, healthy double-digit growth is an achievement.
- Office revenue growth is mainly driven by the number of paid subscriptions, and price increases as corporations switch to more pricy Office 365 subscription plans like Office E5 . E5 offers much more value for them and more revenue for Microsoft.
- Microsoft also increased its Office 365 pricing in March 2022 . This change will take time to be fully visible in revenue because corporate contracts are usually for several years.
- Office revenue growth is stable. It grows at a similar rate for several years without too much variability.
LinkedIn revenue grew by $3.5 billion (+34%) to 13.8 billion of revenue in 2022. LinkedIn was the third most important Microsoft revenue growth driver in the 2022 fiscal year.
- The main factor behind LinkedIn revenue growth was advertising revenue (Marketing Solutions offering) which was growing strongly, at least for the first part of the 2022 fiscal year. Revenue growth slowed in the last quarter, influenced by a slowdown in advertising and job postings.
Microsoft’s Search advertising revenue grew by $3.1bn (+36%) to $11.6 billion in 2022.
- Search advertising revenue literally jumped in the 2022 fiscal year after growing slowly for the past several years.
- Fast revenue growth was driven by digital advertising market growth in the first half of the 2022 fiscal year, with a significant slowdown in the last quarter, which was also in line with the advertising market.
- Search advertising has significant potential for growth if Microsoft manages to fix its Edge/Bing combo of products. Until this happens, Microsoft will continue to lose around $25 billion of revenue to Google every year as Windows users switch to Chrome and Google search on desktops.
Azure, Office, LinkedIn, and Search advertising were the core drivers of Microsoft’s revenue increase in 2022. However, let’s now look also at other selected revenue streams.
Microsoft Windows revenue grew by $1.5 billion (+7%) to $24.8 billion in 2022. It is a pretty good growth rate for Windows.
- Windows revenue growth was driven by lower growth in commercial licenses offset by higher growth of OEM licenses for an entire year. OEM revenue dropped in the last quarter of Microsoft’s fiscal year compared to the same quarter in 2021. inline with PC sales.
- Commercial Windows revenue growth significantly slowed down in Q4. However, it was mainly thanks to dollar appreciation.
- PC sales and Windows OEM revenue are still higher than before the pandemic.
- “Despite a changing market for PCs during the quarter, we continue to see more PCs shipped than pre-pandemic, and are taking share” — Satya Nadella, CEO of Microsoft, Earnings Call in July 2022
- Windows is still a significant piece of Microsoft’s revenue. Its share of revenue is gradually decreasing each year. Windows revenue is still growing but not as fast as other revenue streams.
Microsoft’s Gaming revenue grew by $0.9 billion (+6%) to $16.2 billion in 2022.
- Gaming revenue growth significantly slowed down in 2022 (+6%) compared to 2021 (+33%). The reason is that 2021 was a one-off year that combined revenue growth from sales of the new generation of Xbox consoles and a significant increase in revenue from content sold on the Xbox platform.
- Gaming is a small part of Microsoft’s revenue, currently with an 8% share of the revenue.
- Microsoft’s gaming revenue might jump to $25 billion next year or the year after. For that, the announced Activision Blizzard acquisition has to be approved by regulators.
Microsoft Dynamics 365 revenue grew by ≈$0.9 billion to ≈3.1 billion (+39%) in 2022
- Dynamics is fast growing revenue stream worth mentioning. It is currently relatively small and does not get mentioned too much. But with a roughly 40% growth rate, it could be a sizable revenue stream in five years.
- Dynamics 365 is Microsoft’s alternative to some of Salesforce’s products, and it looks like Microsoft continues to invest heavily in Dynamics. And no wonder, since this fits so well in its portfolio of products.
🔵 What else should you know about Microsoft revenue?
Consumers are not as important for Microsoft’s revenue as it might seem from the popularity of its products among consumers. Most revenue from Office, Windows, and other products comes from business customers. The only exception is Gaming.
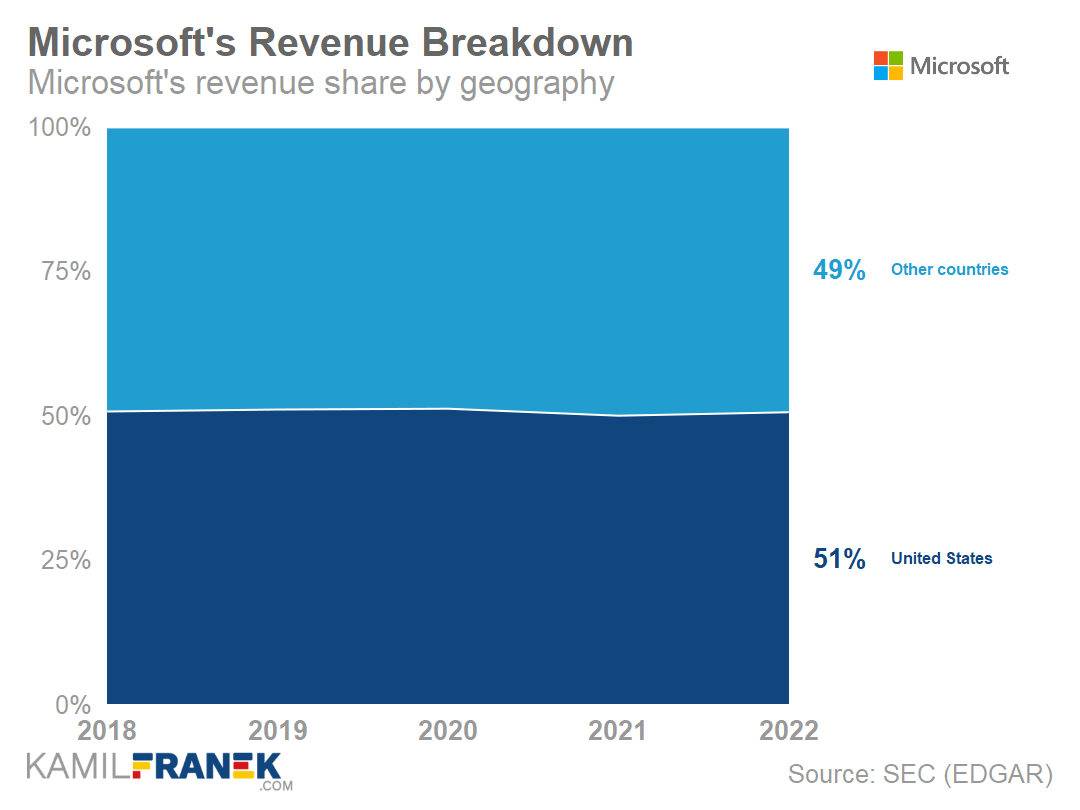
Microsoft is an international company selling its product around the globe and earning roughly half of its revenue from outside the US. In 2021, revenue from outside of the US was for one fiscal year slightly higher than US revenue. However, this changed in 2022. Currently, Microsoft’s US revenue share is 51%.
Microsoft breakdowns its revenue, expenses, and operating income into three much broader official segments. I did not use this categorization because more detailed data is available for revenue. For completeness, here is the revenue split by Microsoft’s segments.
- Productivity and Business Processes segment earned $63.4 billion in revenue in 2022. This segment is mainly defined by Office but also includes LinkedIn and Dynamics.
- Intelligent Cloud segment earned $75.3 billion in revenue in 2022. As the name suggests, the biggest piece is Azure, but a significant part is server products and developer tools. It also includes Microsoft’s enterprise services.
- More Personal Computing earned $59.7 billion in revenue in 2022. This is a kind of catch-all category that includes Windows, Gaming, Search advertising, Surface, and others.
🔮 What is the outlook for Microsoft’s revenue going forward?
It is nearly certain that Azure will become the biggest Microsoft’s revenue stream in the 2023 fiscal year. This will make 2023 year an important milestone in Microsoft’s history.
Microsoft revenue growth will be mainly determined by Azure and Office. Therefore, revenue is expected to grow in double digits.
- The price increase in Office subscriptions in March 2022 will influence revenue growth in the next two years.
Weaknesses in PC, advertising, and gaming might continue into the 2023 fiscal year based on the general economic situation, but they are not the core of Microsoft’s revenue.
Advertising is currently a small part of Microsoft’s revenue, but Xandr’s acquisition and the announcement that Microsoft and Netflix will work on an ad-supported offer might change things.
Microsoft is optimistic.
“No company is better positioned than Microsoft to help organizations deliver on their digital imperative, so they can do more with less.” — Satya Nadella, CEO of Microsoft, Earnings Call in July 2022
“We continue to expect double-digit revenue and operating income growth in both constant currency and US dollars.” — Amy Hood, CFO of Microsoft, Earnings Call in July 2022
🟠 Microsoft’s Expenses Overview & Analysis (2022)
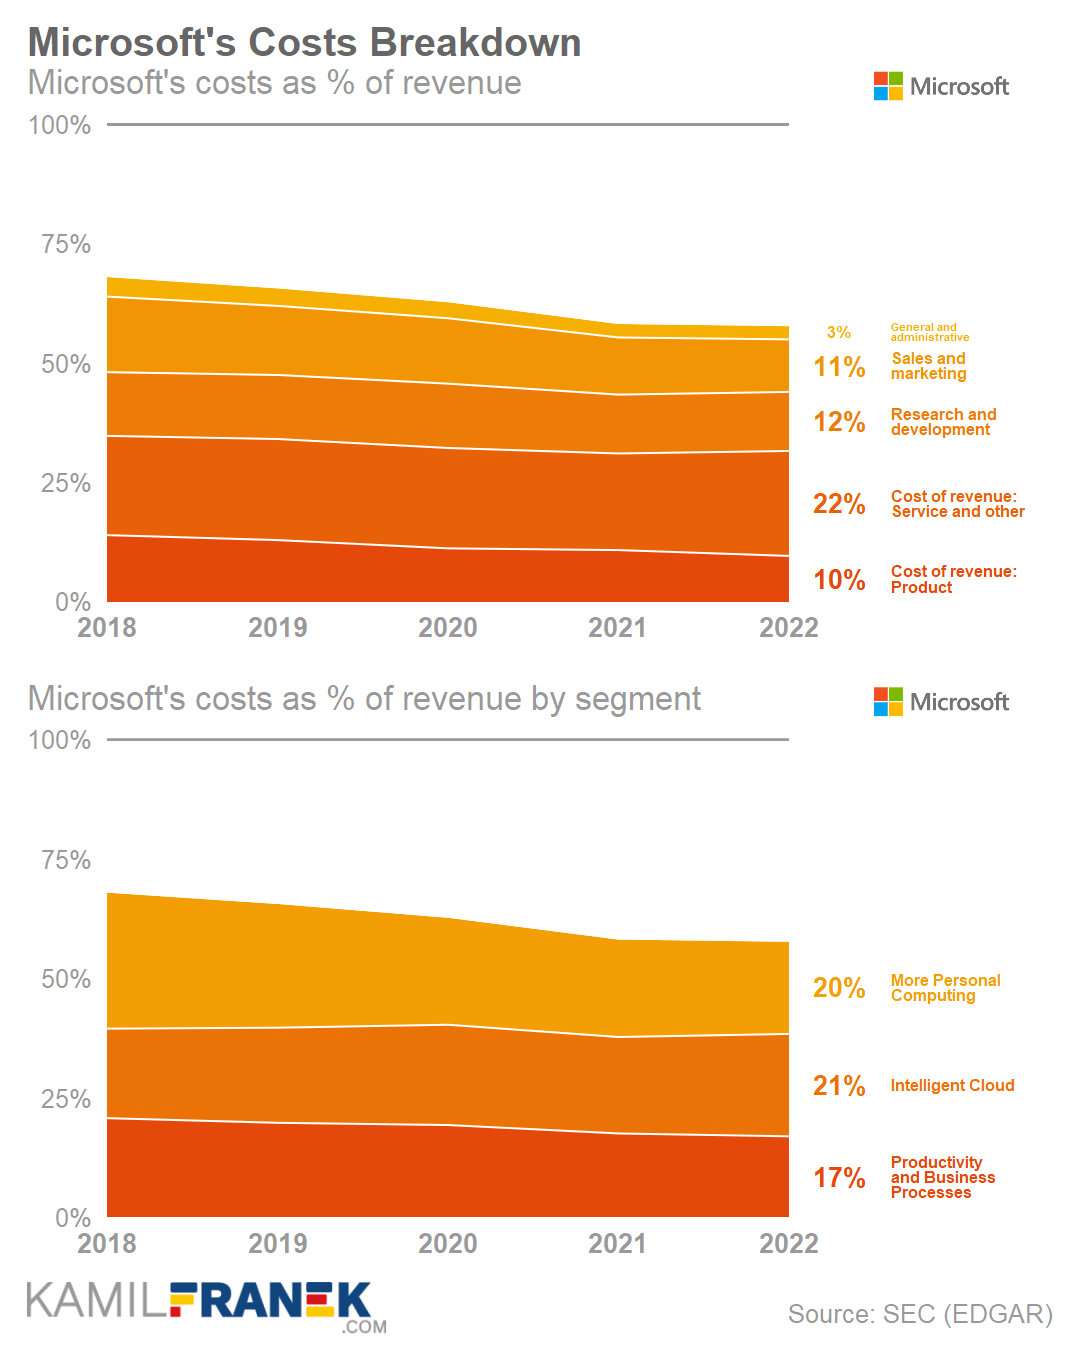
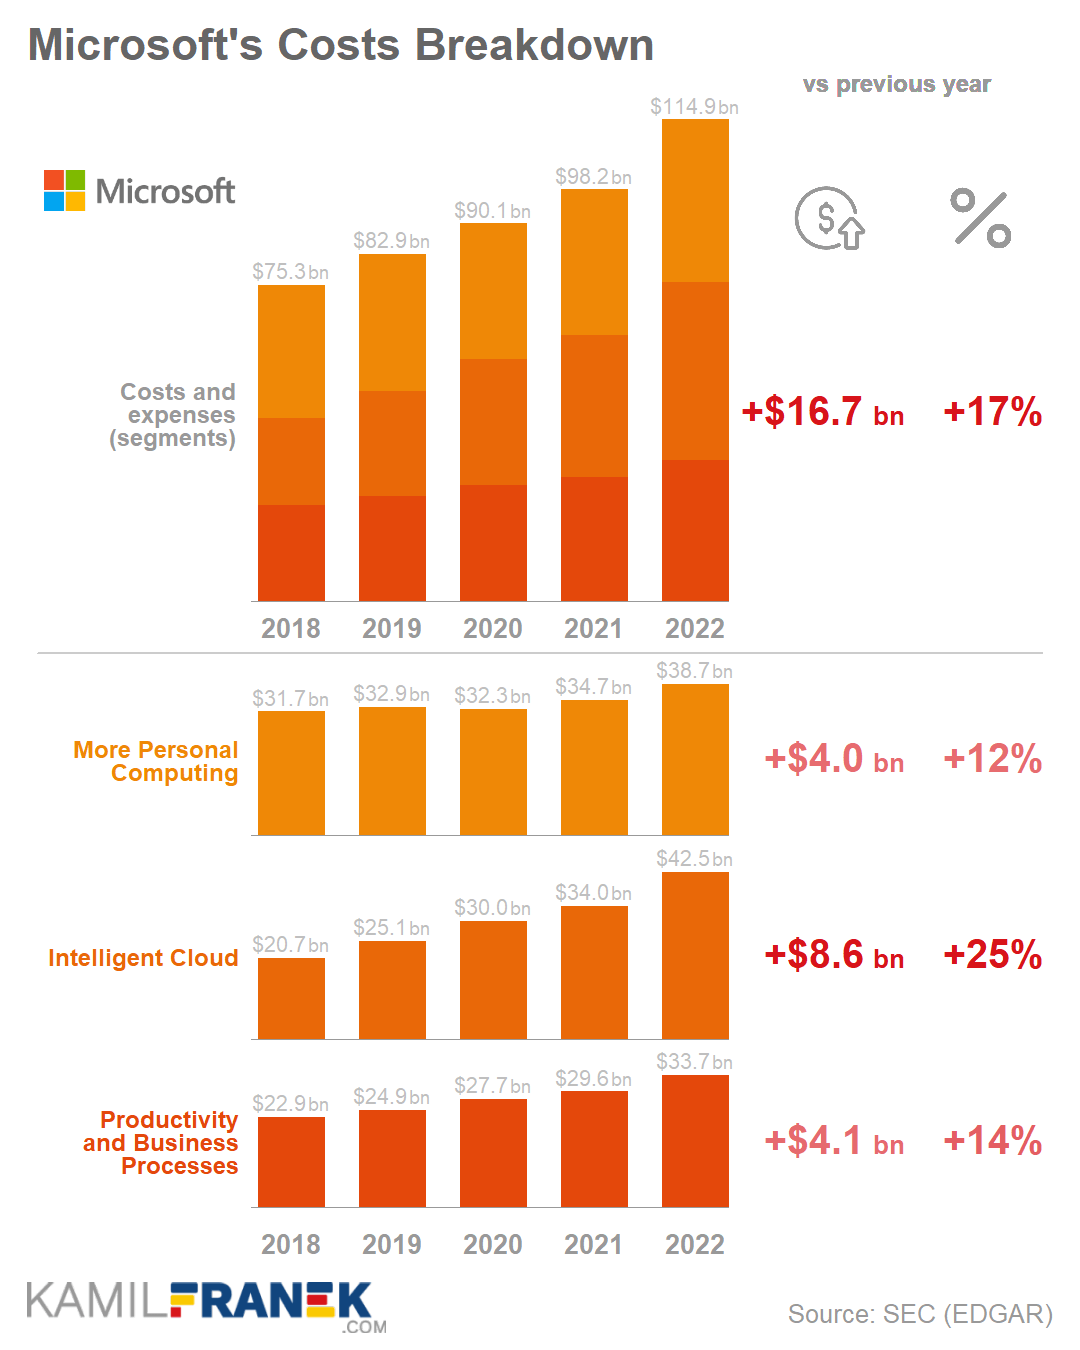
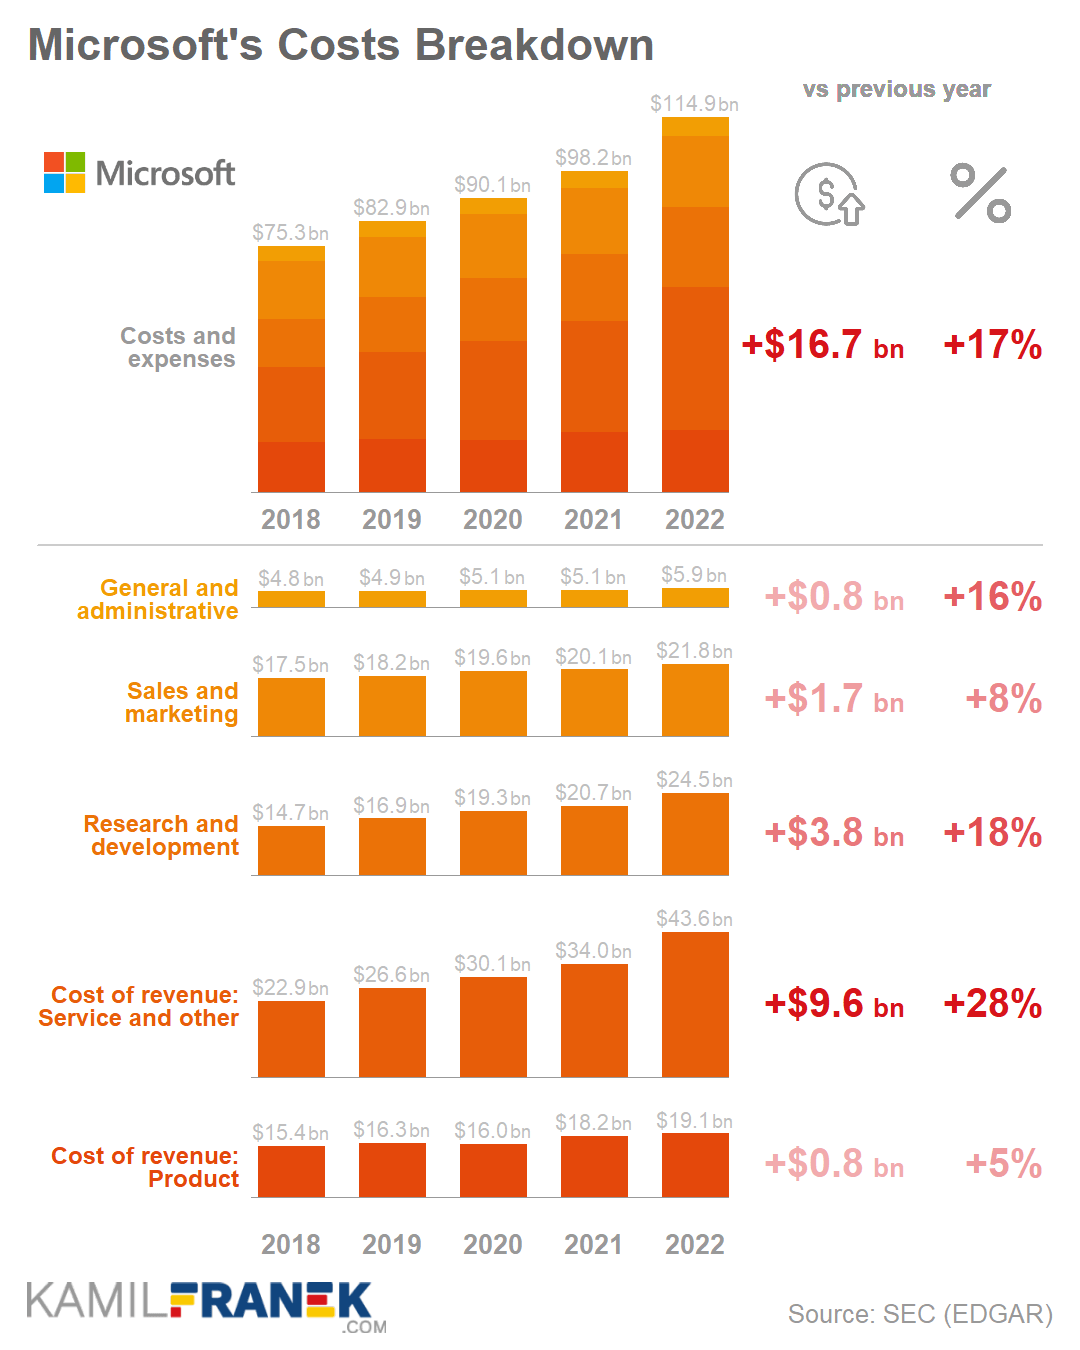
Microsoft’s total expenses were $114.9 billion in 2022, up $16.7 billion (+17%) from a year earlier. Microsoft’s largest expense categories in its income statement were cost of revenue ($62.6bn), research and development ($24.5bn), and sales and marketing ($21.8bn).
Let’s now look at an analysis of what those expenses in Microsoft’s profit & loss statement consist of and how they changed.
🟠 How does Microsoft spend $115 billion annually in expenses?
Microsoft spent $114.9 billion on expenses in 2022. That amount can be split based on related product segments to Intelligent Cloud ($42.5bn of expenses), More Personal Computing ($38.7bn), and Productivity and Business Processes ($33.7bn)
- Intelligent Cloud segment is mainly about Azure Cloud and Server Products. More Personal Computing segment includes Windows, Gaming, Search advertising, and Surface. Productivity and Business Processes segment is mainly about Office products and services, LinkedIn, and Dynamics.
- To some extent, it is helpful that Microsoft splits its expenses also to the segments mentioned above in addition to standard income statement categories. However, its usability is limited because some expenses connected to multiple products are split based on relative revenue and relative gross margin.
A big part of Microsoft’s expenses is headcount related. This is often the case for any software company. Microsoft had 221 000 employees at the end of the 2022 fiscal year.
The largest category of Microsoft expenses is the cost of revenue, where Microsoft spends $62.6 billion. It is spent mainly on manufacturing and distribution costs, operating costs related to product support, money paid to equipment manufacturers to drive traffic to Microsoft websites, and on support and maintenance of online products and services, which also includes data center costs.
- At the end of the 2022 fiscal year, 85 000 employees worked in operations-related positions.
Microsoft spends $24.5bn on research and development, mainly on expenses related to 73 000 employees working in research and development. Therefore this amount mainly consists of Payroll, Employee benefits, stock-based compensation, and other headcount-related expenses.
Microsoft spends $21.8bn on sales and marketing. This amount is mainly connected with the cost of 47 000 Microsoft employees working in sales & marketing. Just a smaller part is spent on external advertising or promotions.
Microsoft spent $5.9bn on general and administrative expenses. Those are mainly payroll and other headcount-related expenses for 16 000 employees in supporting and administrative functions.
🟠 Why Microsoft’s expenses increased by $16.7 billion (+17%) in 2022?
Microsoft’s total expenses increased by $16.7 billion (+17%) to $114.9 billion in 2022. This large jump is partially caused by a depreciation change that decreased 2021 expenses. Even without this change, expenses would grow significantly, and an important driver was a jump (+22%) in headcount.
The expense item with the largest increase was the cost of revenue, which grew by $10.4bn (+20%), and mainly was cloud related. Significant was also expense increase in research and development by +$3.8bn (+18%).
The increase in the cost of revenue which was up by $10.4bn (+20%), was partially caused by artificially lowered depreciation expense in the previous fiscal year, thanks to an accounting change. This change influenced many items from Microsoft’s income statement, like the cost of revenue, total expenses, operating income, and net income.
- Without this accounting change cost of revenue would be up by up by 15% this year, and total Microsoft expenses would grow by 14% instead of the reported 17%, which is well below 18% revenue growth.
- What accounting change influenced the result? In the previous fiscal year, Microsoft changed the amortization length for its server and network equipment from 3 to 4 years. This meant that depreciation expense in the 2021 fiscal year was decreased by $2.7bn, and the offset of this decrease was spread out to future years.
- Amortization of server and network equipment is part of the costs of revenue. Therefore it distorted its growth both in 2021 and 2022. In 2021, the cost of revenue growth looked artificially low, and in 2022 growth looked artificially high.
- But there is more to come. Microsoft announced that next fiscal year (2023), it would increase the useful life of its server and network equipment again from 4 to 6 years.
- It will decrease 2023 expenses by $3.7bn, so expense growth will look low, and margins will jump up that year.
Microsoft was on a hiring spree in 2022. The company increased its headcount by 40 000 employees (+22%) in 2022, which was an important driver of higher expense growth compared to previous years.
- Part of headcount growth (6 percentage points) was thanks to Nuance acquisition and partially also Xandr acquisition.
- Neither Nuance nor Xandr is, at this moment, a business with margins comparable to Microsoft overall. Including these acquisitions into Microsoft’s financials drove expenses up but did not help so much with revenue growth.
- Employee increase of 40 000 overall can be broken down further to:
- Operations: +18 000 (+27%)
- Research and development: +13 000 (+22%)
- Sales and marketing: +7 000 (+18%)
- General and administrative: 2 000 (+14%)
🟢 Microsoft’s Operating Margin Overview & Analysis (2022)
Microsoft’s Operating income was $83.4 billion in 2022, up $13.5bn (+19%) from a year earlier. Operating income as % of revenue (margin) was 42%, similar to the previous year. This is a huge margin and not the one that can be seen in just any income statement.
🟢 How does Microsoft generate $83.4 billion of operating income (42% margin)?
Microsoft earned $83.4 billion of operating income in 2022. It can be broken down by segment into Intelligent Cloud ($32.7bn), Productivity and Business Processes ($29.7bn), and More Personal Computing ($21bn).
Microsoft’s overall operating margin is 42% of revenue. If split by segments, Productivity and Business Processes segment has a 47% operating margin, Intelligent Cloud is 43%, and the More Personal Computing segment is 35%.
Microsoft is a hugely profitable business. The margins it can generate are breathtaking, and Microsoft so far has managed to increase them each year.
Next year, we can be certain of another significant margin increase, although this time, it will be driven by the change in how long Microsoft amortizes data center equipment. They will prolong it from the current four to six years, decreasing depreciation in 2023 and moving it to future years.
🟢 How Microsoft increased its operating margin by $13.5 billion (+19%) in 2022?
Microsoft’s operating income increased by $13.5 billion (+19%) to $83.4 billion in 2022. The biggest drivers were Intelligent Cloud segment, which was up by $6.6bn (+25%), Productivity and Business Processes segment (+5.3bn / +22%). The worst performing was More Personal Computing segment (+1,5bn / +8%)
The expense growth rate was just below the revenue growth in 2022. This meant that overall operating as % of revenue stayed roughly at the same level of 42%. Usually, in previous years, the rate of expenses growth was significantly below revenue growth, which drove an operating margin increase.
Microsoft has expenses under control. Thanks to the lower expense growth compared to revenue over the past several years, we can see how Microsoft’s operating margin continues to increase from 30% in 2017 to 42% in 2022.
- To hold margins at the same level as last year in the current economic situation is a sign of the strength of Microsoft’s business.
💵 Microsoft Cash Flow Statement Overview & Analysis (2022)
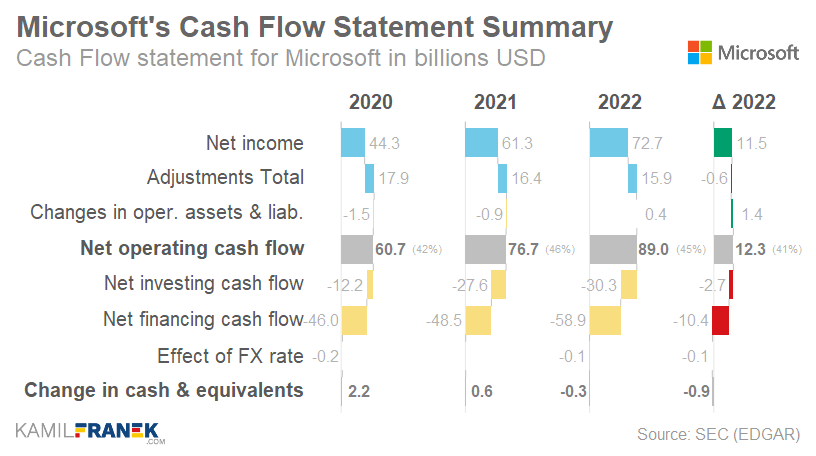
Microsoft generated $89 billion of operating cash flow in 2022, up $12.3bn (+16%) from a year earlier. Microsoft spent this money on property and equipment ($23.9bn) and returned money back to investors ($50.8bn). It also spent a lot on acquisitions ($22bn), mainly on Nuance ($18.8bn).
The cash flow statement offers us a different way to analyze Microsoft’s business. How much cash is Microsoft making, and where does it flow? How much of it is invested back, and how much is paid out to investors?
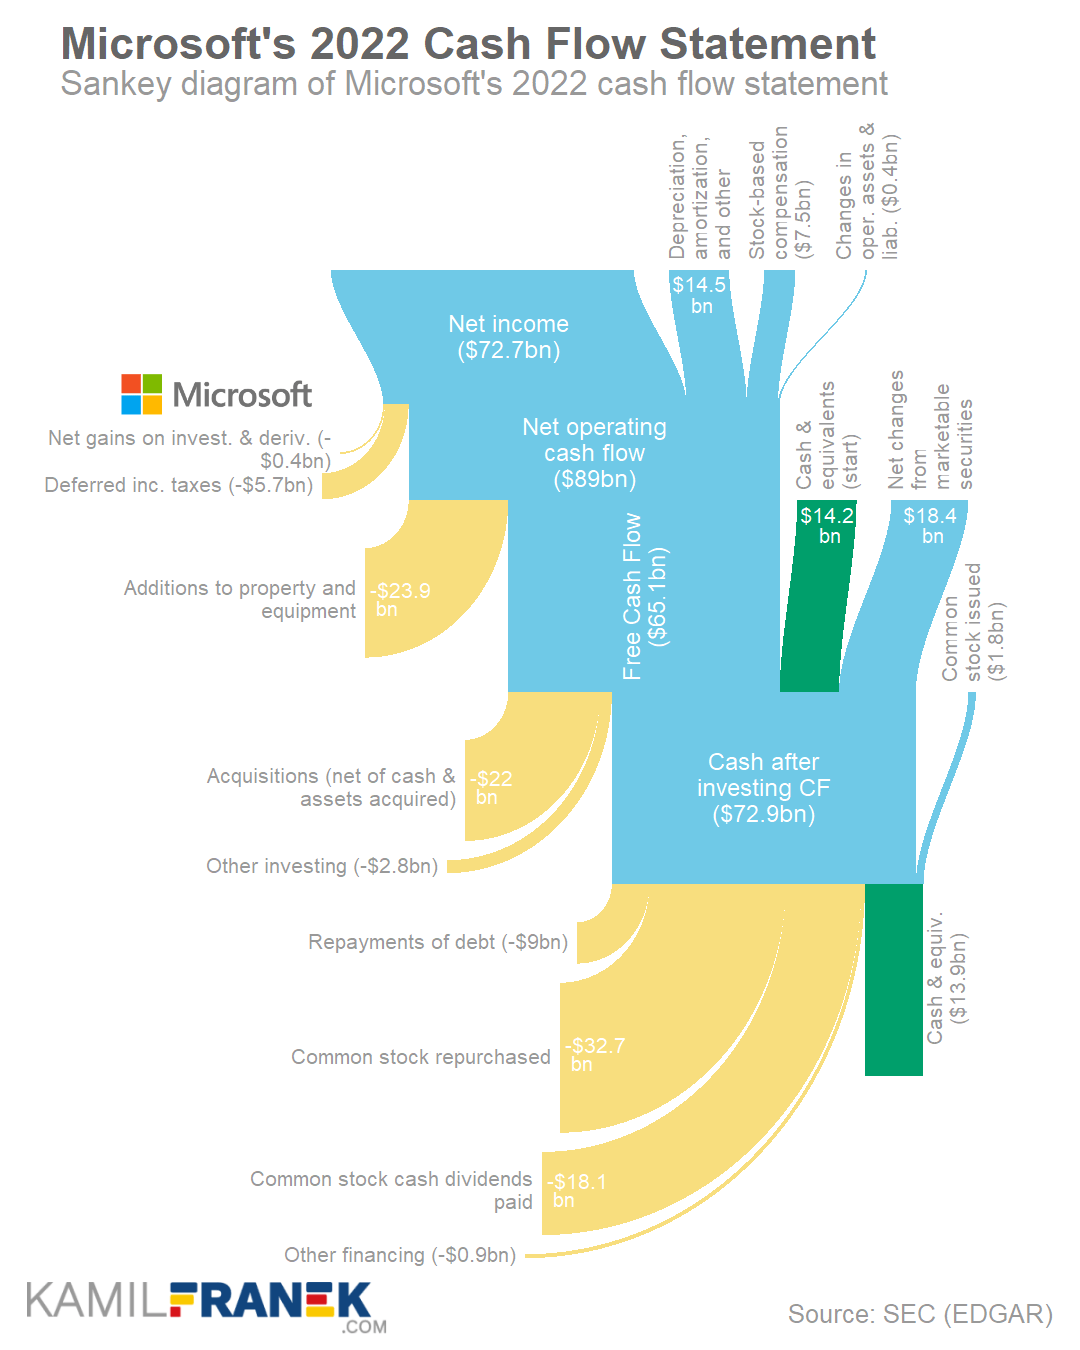
Microsoft’s operating cash flow was $89 billion in 2022, up $12.3bn (+16%) compared to the previous year.
Microsoft’s investment in property and equipment was $23.9 billion in 2022, up $3.3bn (+16%) from a year earlier. This primarily reflects Microsoft’s continued investment in its network of data centers, which are the beating heart of today’s Microsoft.
Microsoft’s free cash flow, calculated as operating cash flow decreased by investment into property and equipment, was +$65.1 billion in 2022, up $9bn (+16%).
- Microsoft is generating a huge amount of free cash flow that is not widely different from its profits of 72.7bn, which is what we should expect from a mature company like Microsoft.
- Above mentioned amount of “standard” free cash flow does not fully reflect the purchase of property and equipment through leases. Lease financing is not comparable with loan financing when it comes to cash flow statement reporting. Adjusted free cash flow that would fix this difference would be at $58bn.
- Unlike with other companies, the level of lease financing is stable throughout the years, and it is not distorting free cash flow too much. But it can still cause problems, especially when compared to other companies with different levels of lease financing.
Microsoft’s net investing cash flow was -$30.3 billion (outflow) in 2022, an outflow increase of $2.7 billion (10%).
- Microsoft investing cash flow flowed predominantly into property and equipment (-$23.9) and acquisitions (-$22). Acquisitions were financed mainly by a decrease in Microsoft cash reserves (-$18.4).
- The largest part of the $22bn of acquisition-related outflow was Nuance acquisition ($18.8bn).
Microsoft’s net financing cash flow was -$58.9 billion (outflow), an outflow increase of $10.4 billion from a year earlier.
- The largest driver of net financing cash flow was returning cash to Microsoft’s investors through stock repurchases ($32.7) and dividends ($18.1).
- The slowdown in Microsoft’s revenue and profit growth did not disrupt its shareholders’ payouts. Microsoft, in total, returned $50.8 billion to investors in 2022 through dividends or buybacks. An increase of $6.9bn (+16%) from a year earlier.
- Microsoft also repaid $9 billion of its debt.
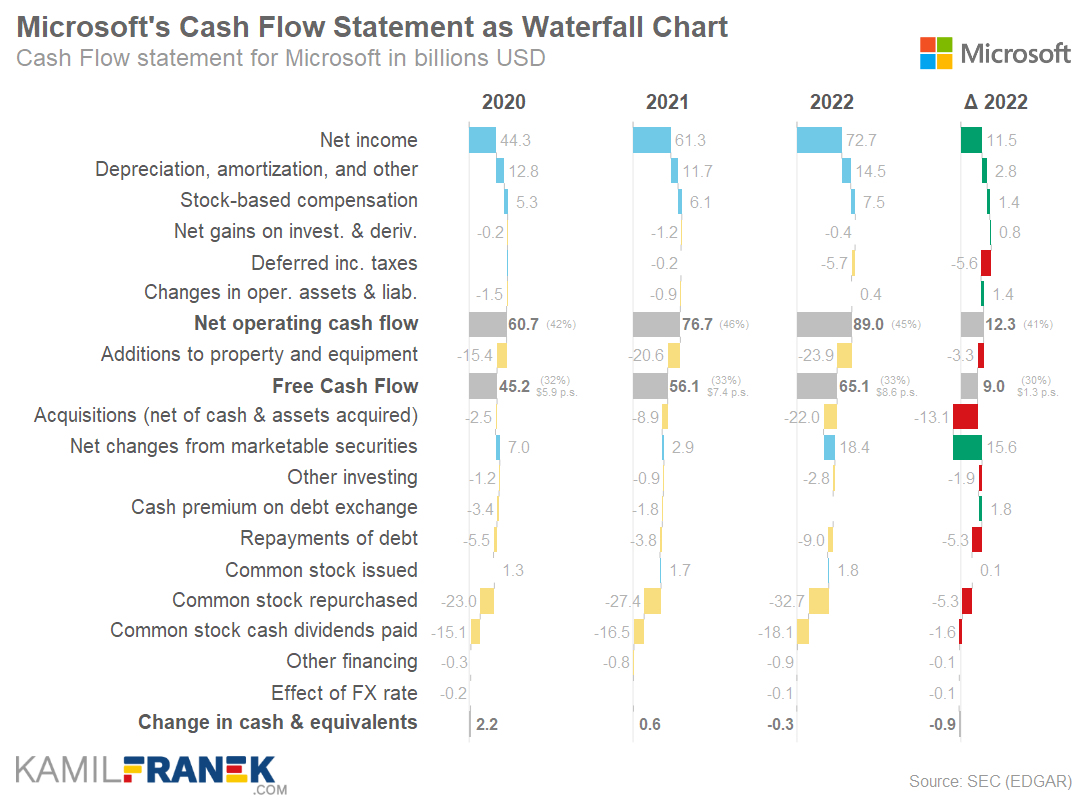
Microsoft’s Cash Flow Statement
| 2020 | 2021 | 2022 | Δ | %Δ | |
|---|---|---|---|---|---|
| Net income | 44.3 | 61.3 | 72.7 | +11.5 | +19% |
| Goodwill and asset impairments | - | - | - | ||
| Depreciation, amortization, and other | 12.8 | 11.7 | 14.5 | +2.8 | +24% |
| Stock-based compensation | 5.3 | 6.1 | 7.5 | +1.4 | +23% |
| Net gains on invest. & deriv. | -0.2 | -1.2 | -0.4 | +0.8 | -67% |
| Deferred inc. taxes | 0.0 | -0.1 | -5.7 | -5.6 | +3 701% |
| Changes in oper. assets & liab. | -1.5 | -0.9 | 0.4 | +1.4 | -148% |
| Net operating cash flow | 60.7 | 76.7 | 89.0 | +12.3 | +16% |
| Additions to property and equipment | -15.4 | -20.6 | -23.9 | -3.3 | +16% |
| Free Cash Flow | 45.2 | 56.1 | 65.1 | +9.0 | +16% |
| Acquisitions (net of cash & assets acquired) | -2.5 | -8.9 | -22.0 | -13.1 | +147% |
| Net changes from marketable securities | 7.0 | 2.9 | 18.4 | +15.6 | +541% |
| Other investing | -1.2 | -0.9 | -2.8 | -1.9 | +206% |
| Net investing cash flow | -12.2 | -27.6 | -30.3 | -2.7 | +10% |
| Cash premium on debt exchange | -3.4 | -1.8 | 0.0 | +1.8 | -100% |
| Issuance (Repayments) of short-term debt | 0.0 | - | - | ||
| Proceeds from issuance of debt | 0.0 | - | - | ||
| Repayments of debt | -5.5 | -3.8 | -9.0 | -5.3 | +141% |
| Common stock issued | 1.3 | 1.7 | 1.8 | +0.1 | +9% |
| Common stock repurchased | -23.0 | -27.4 | -32.7 | -5.3 | +19% |
| Common stock cash dividends paid | -15.1 | -16.5 | -18.1 | -1.6 | +10% |
| Other financing | -0.3 | -0.8 | -0.9 | -0.1 | +12% |
| Net financing cash flow | -46.0 | -48.5 | -58.9 | -10.4 | +21% |
| Effect of FX rate | -0.2 | -0.0 | -0.1 | -0.1 | +386% |
| Change in cash & equivalents | 2.2 | 0.6 | -0.3 | -0.9 | -145% |
⚖️ Microsoft Balance Sheet Statement Overview & Analysis (2022)
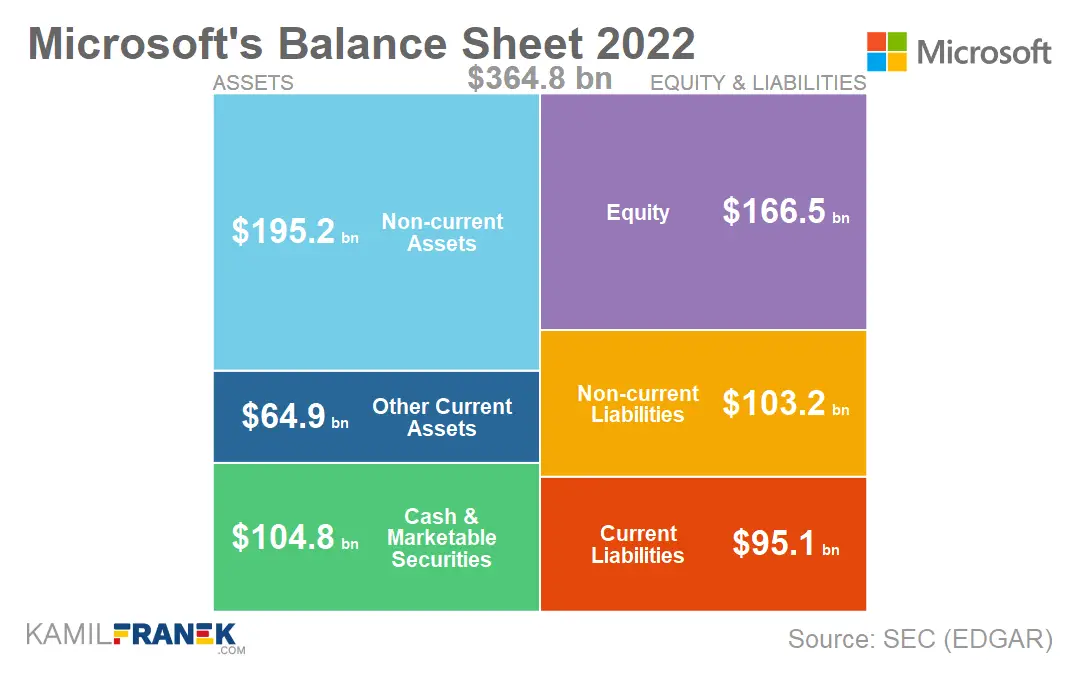
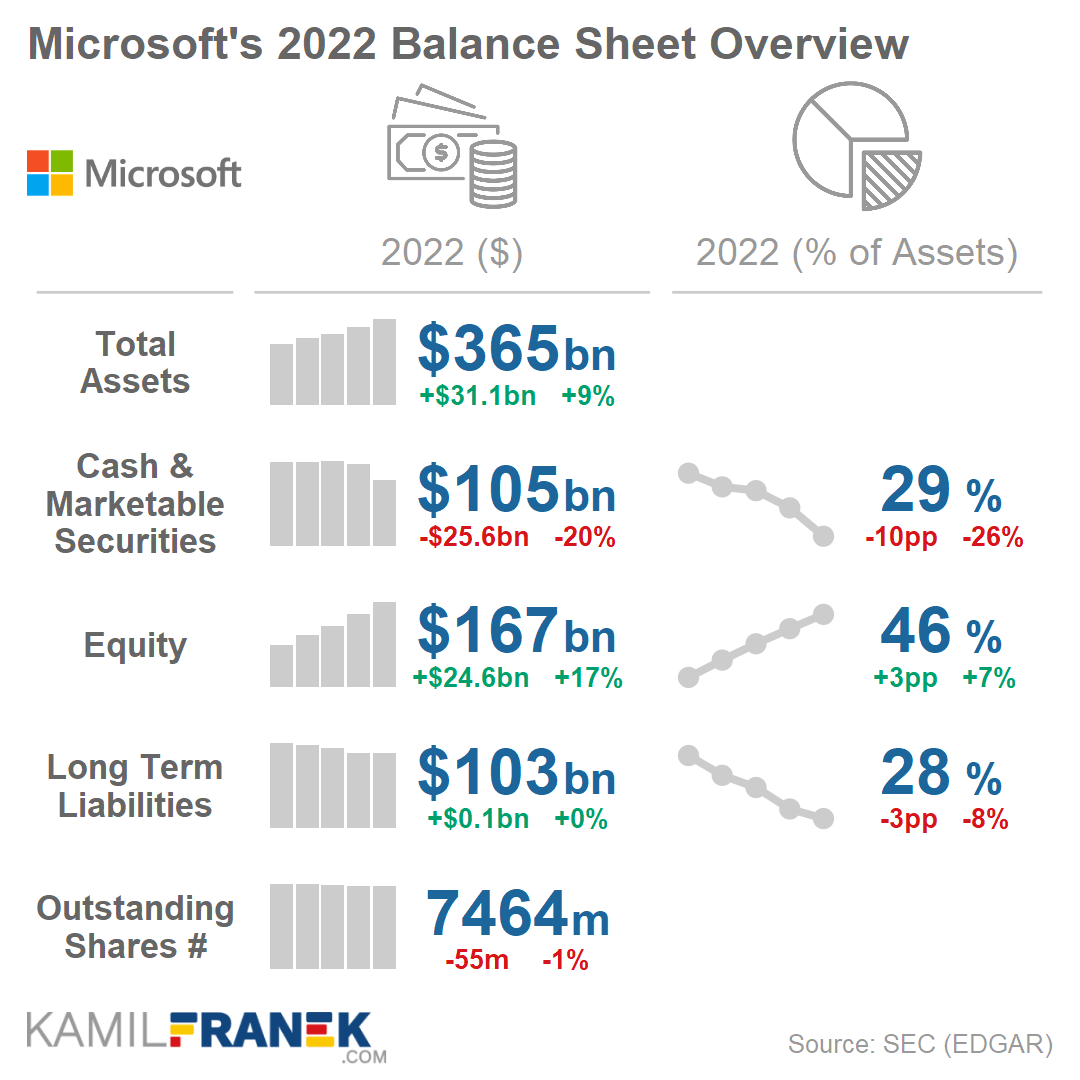
Microsoft’s balance sheet size was $364.8 billion in 2022, up $31.1 billion (+9%) from a year earlier. Microsoft’s balance sheet is strong, with relatively low debt, and 46% of the balance sheet is covered by equity.
The balance sheet statements of technology & software companies like Microsoft are usually straightforward. Unfortunately, it does not show the main part of the business, which is the value of the intellectual property it internally develops.
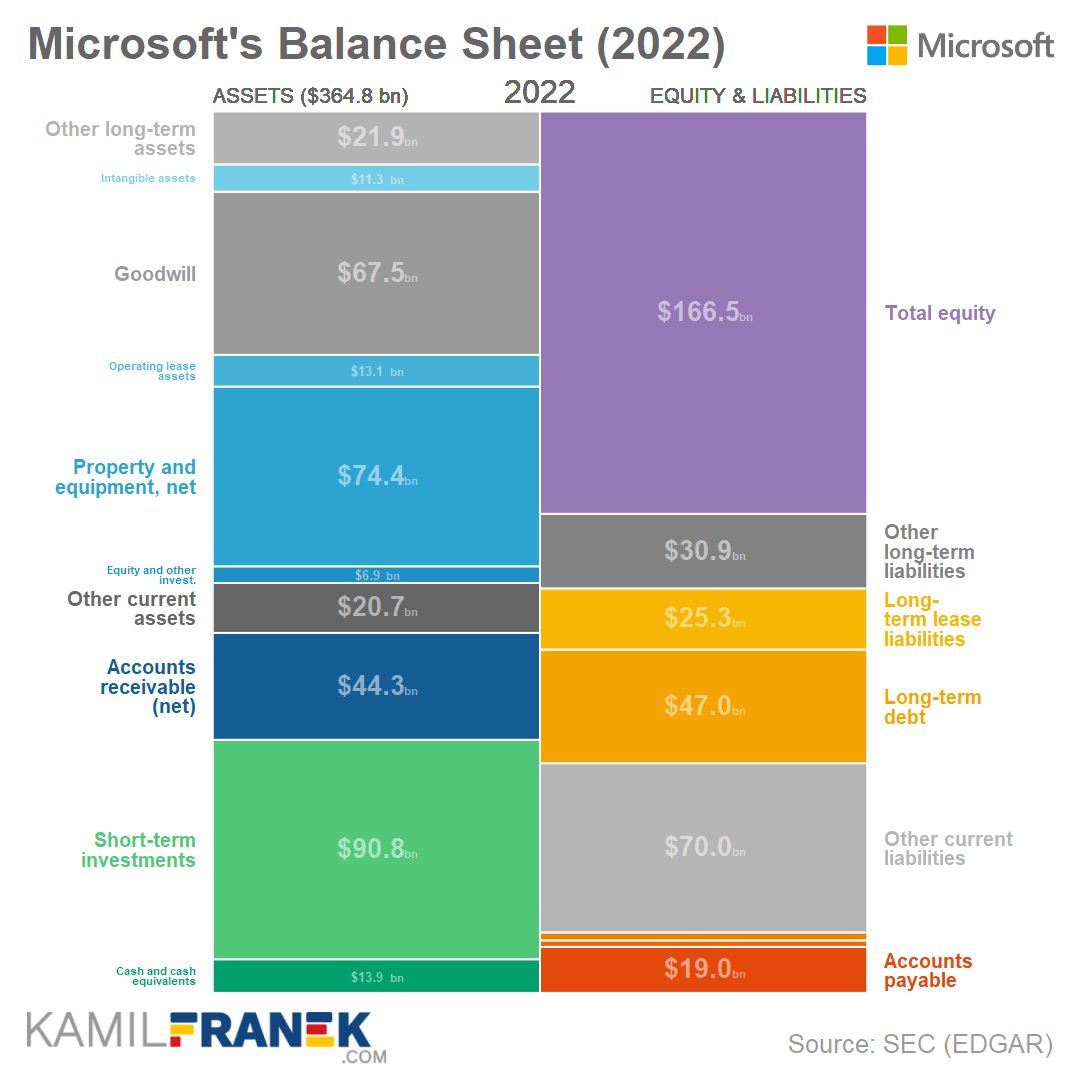
⚖️ What is Microsoft’s assets composition a how has it changed?
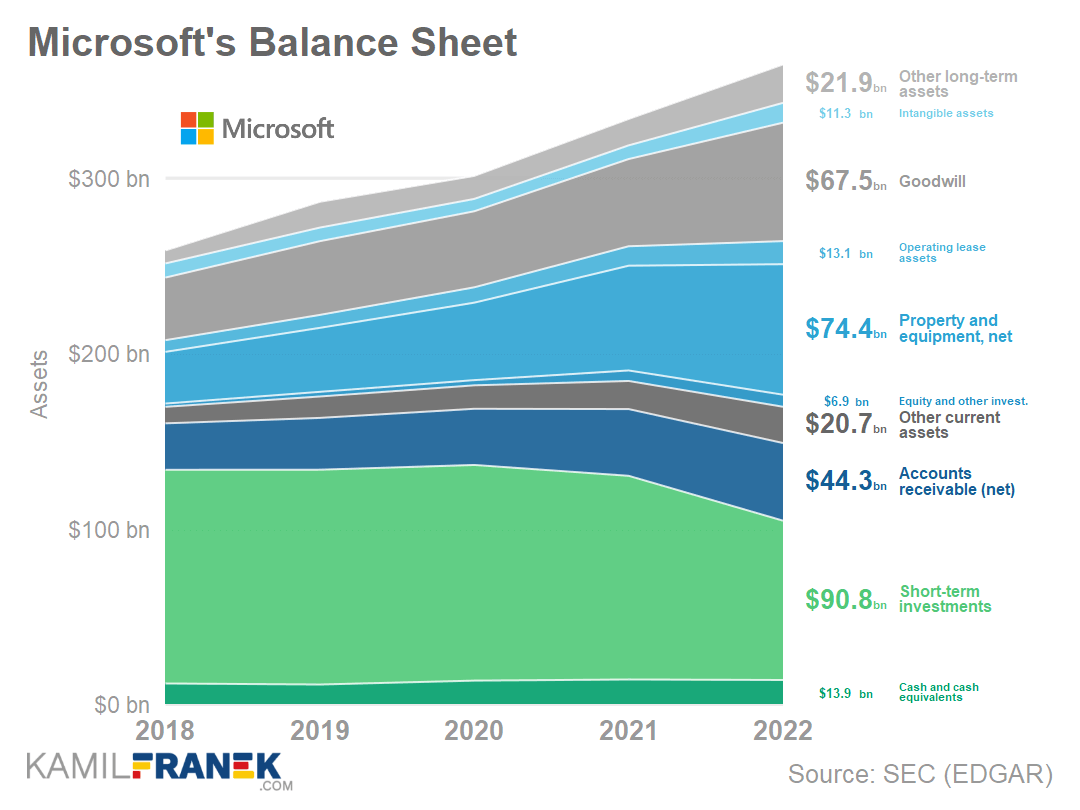
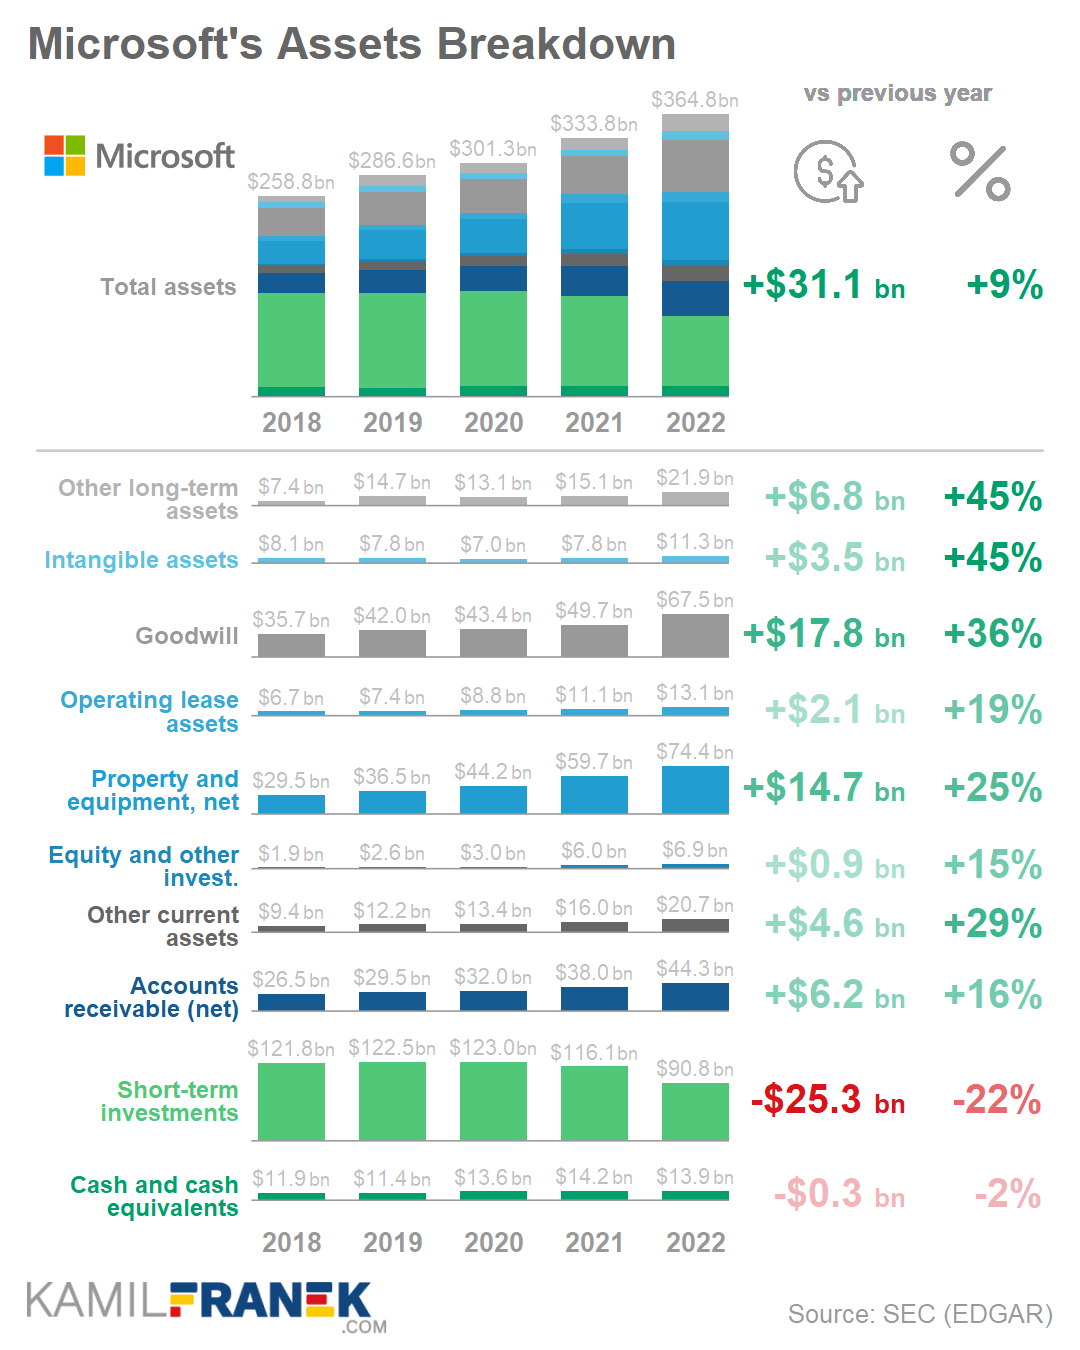
Microsoft’s assets were $364.8 billion in 2022, up $31.1b (+9%) from a year earlier. The main parts of Microsoft’s assets were short-term investments ($90.8bn) which were mainly in government securities, property and equipment ($74.4bn), goodwill ($67.5bn), and account receivable ($44.3bn)
Microsoft’s assets increased by $31.1 billion in 2022. The main drivers of this increase were goodwill (+$17.8bn), Property and equipment (+$14.7), and account receivable (+$6.2bn). These were offset by a decrease in total cash, cash equivalent, and short-term investment (-$25.6bn)
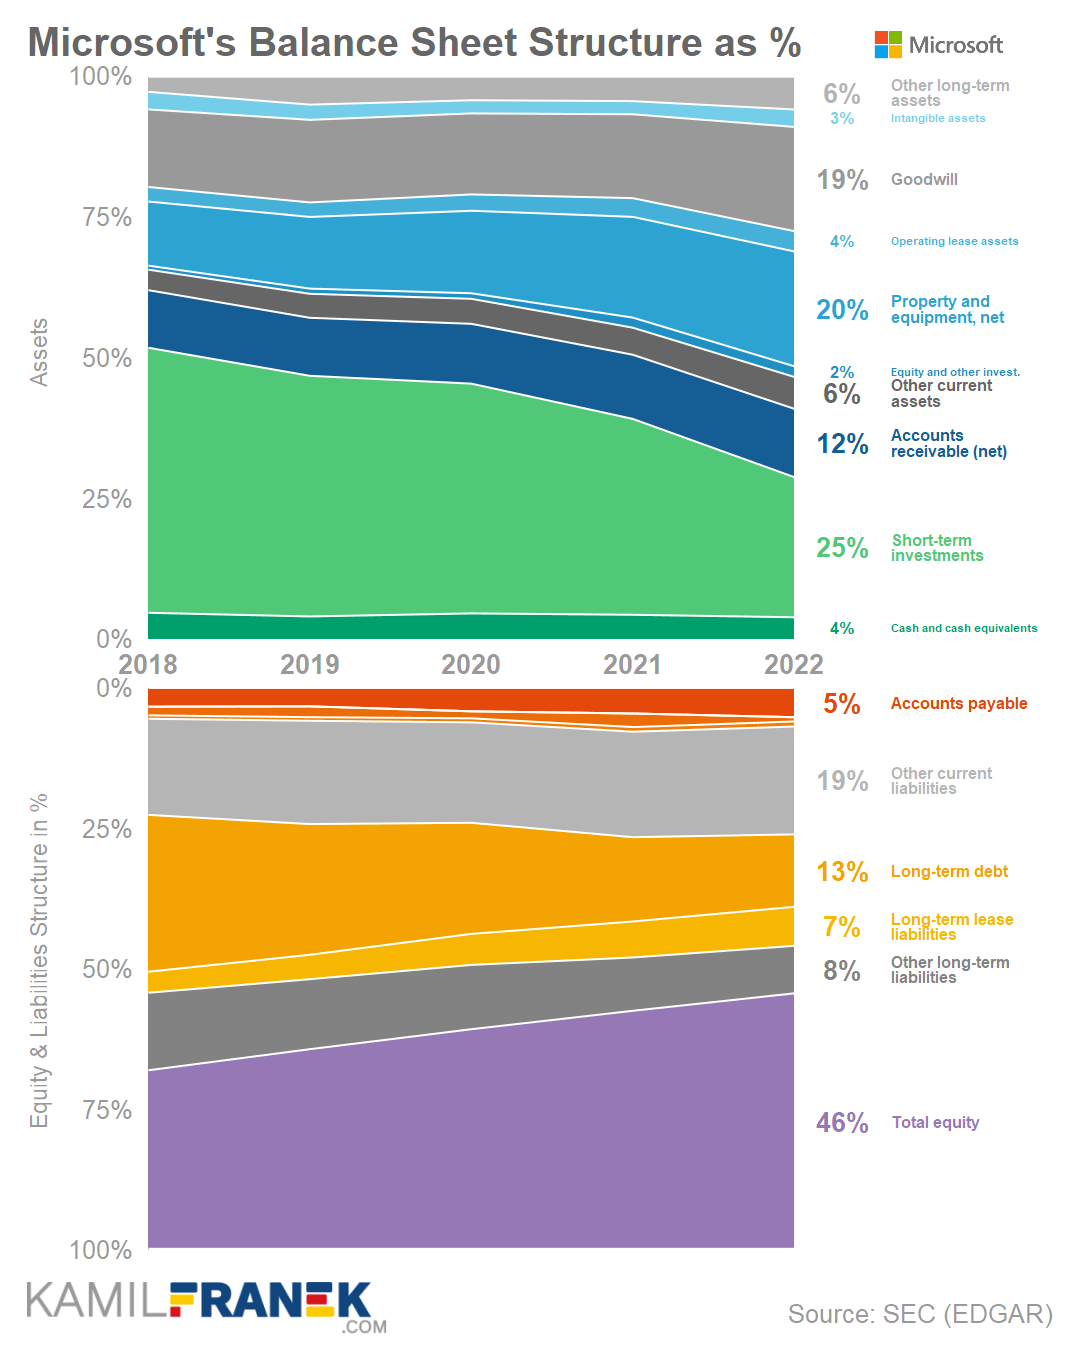
The underlying long-term trend of Microsoft’s asset structure is growth in the share of property and equipment and growth of Goodwill, which reflect Microsoft’s investments. At the same time share of cash and marketable securities on the balance sheet decreased.
- These long-term trends continued in 2022 with more rapid change in Goodwill and marketable securities due to the Nuance acquisition.
Microsoft’s property and equipment were $74.4 billion in 2022, up $14.7bn (+25%) from a year earlier. The driver of this increase was mainly investment into Microsoft’s Azure data center infrastructure.
- Azure infrastructure is used not only as a product rented to Microsoft’s business customers. Azure is also the infrastructure used to run many of Microsoft’s own cloud-based products and services.
- Property and equipment share on assets is increasing each year. It is 20% currently, which is multiple of what we could see years ago. Microsoft is becoming more asset-heavy thanks to data center investments.
Microsoft’s goodwill was $67.5 billion in 2022, up $17.8 billion (+36%) compared to the previous year.
- Goodwill is another sizable item with an increasing share on Microsoft’s balance sheet. It increased mainly thanks to several large acquisitions like LinkedIn (2017 fiscal year) and, more recently Nuance (2022 fiscal year)
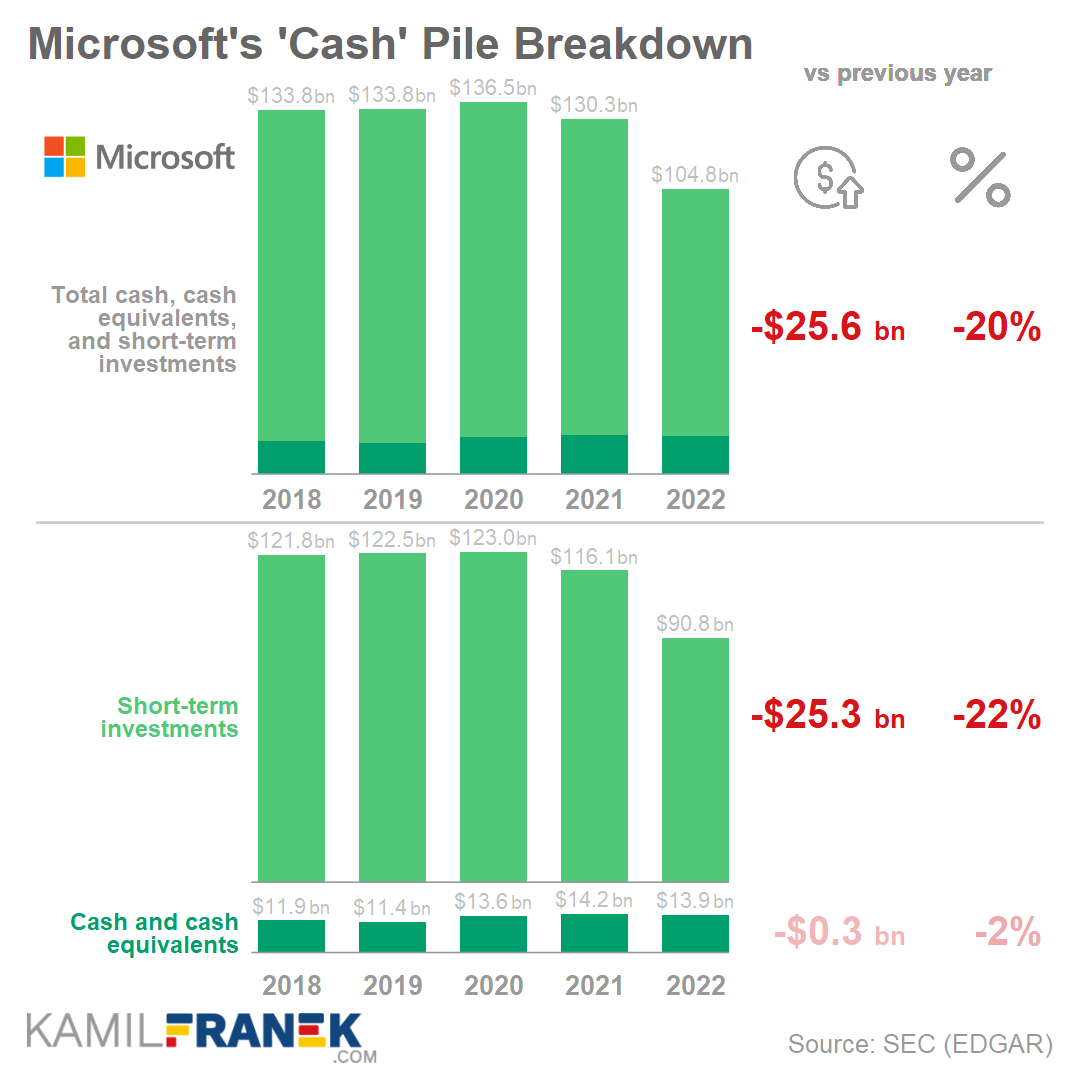
Microsoft cash, cash equivalent, and short-term investments totaled $104.8 billion in 2022, down by $25.6 billion (-20%) from a year earlier. The decrease was driven by Nuance acquisition.
- Until the drop in 2022, Microsoft’s cash pile was relatively stable in nominal amounts. However, as % of total assets, it was decreasing.
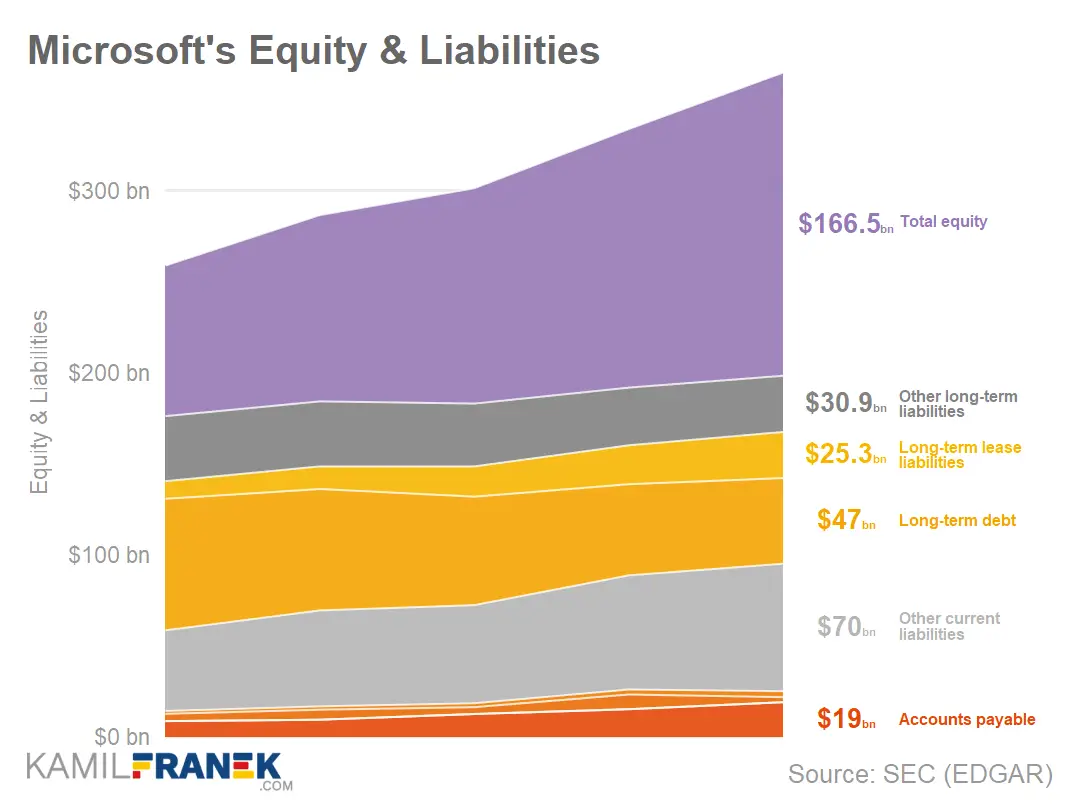
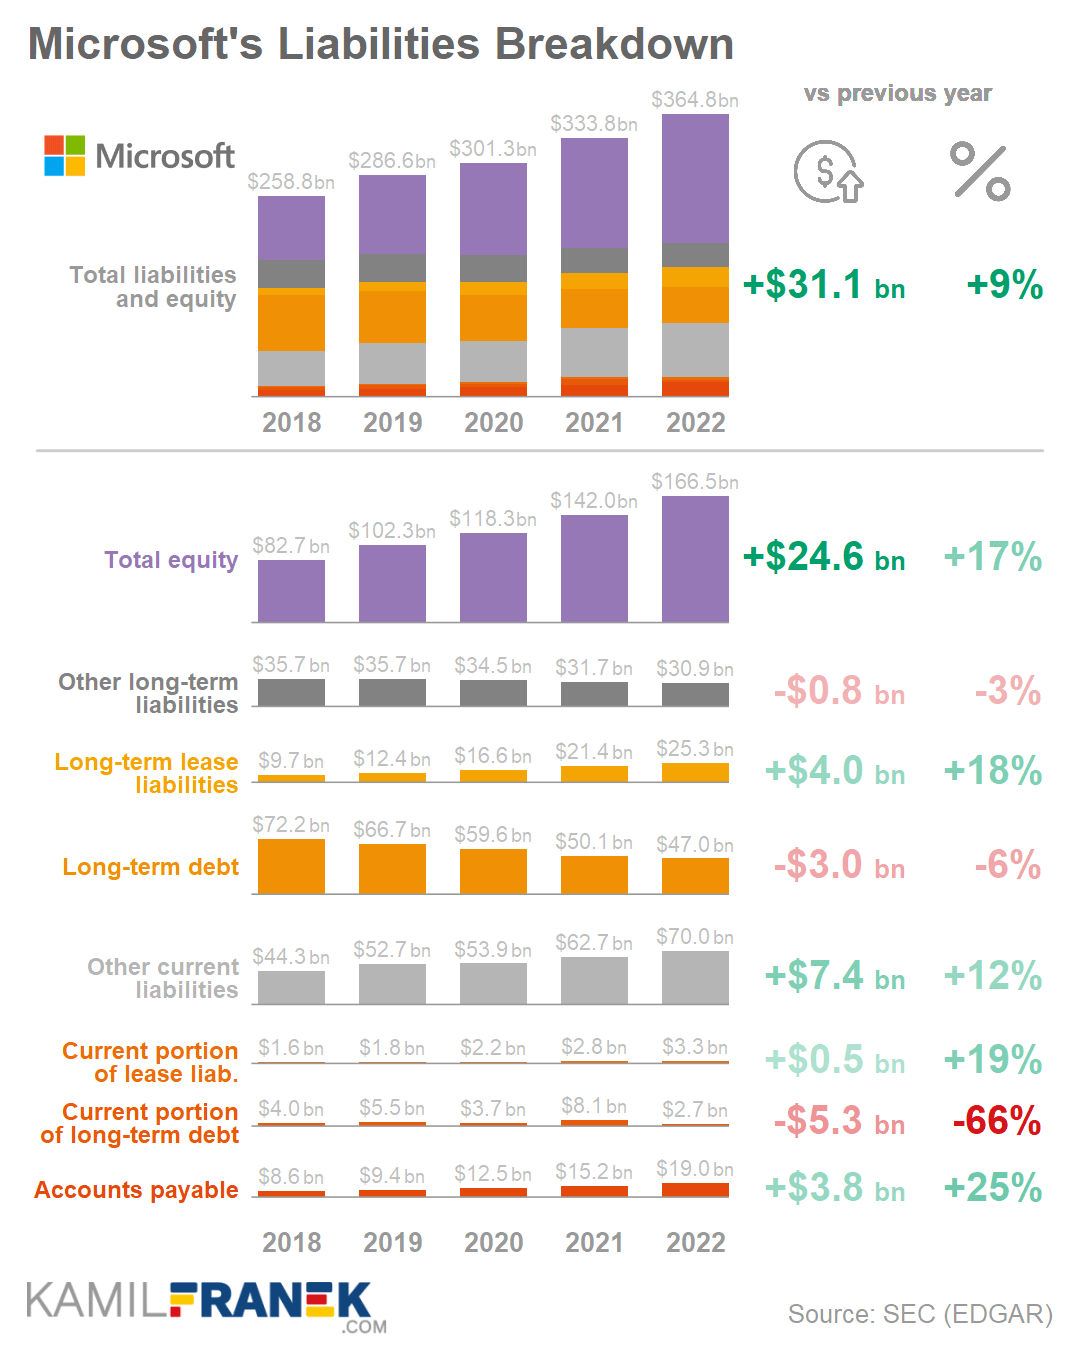
⚖️ What is Microsoft’s equity and liabilities composition, and how has it changed?
Microsoft’s total liabilities were $198 billion in 2022, up $6.5 billion (+3%) from a year earlier.
- The main parts of Microsoft’s $198bn of liabilities are long-term debt ($47bn), short-term deferred revenue ($45.5bn), and long-term income taxes ($26.1bn).
- Microsoft’s liabilities increased by 6.5 billion (+3%) in 2022. The main drivers of this small increase were accounts payable and deferral, offset partially by a decrease in debt.
Microsoft’s total equity was $166.5 billion in 2022, up $24.6 billion (+17%) compared to the previous year. The increase is, obviously, driven by Microsoft’s sizable profits.
🔴 How much debt does Microsoft have?
Microsoft had $49.7bn billion of long-term debt on its balance sheet in 2022, down by $8.3 billion (-15%) and an additional $28.6 billion in lease liabilities that increased by $4.5bn in 2022.
Microsoft is a company with a low level of debt. Especially when you take into account that at the same time, it had $105 billion in cash & marketable securities.
- Relative to its balance sheet, long-term debt is low, with a 14% share. Lease liabilities make up another 8% of Microsoft’s balance sheet.
- Long-term debt is decreasing as % of the balance sheet and also nominally since the 2017 fiscal year when Microsoft took on long-term debt to finance its $26bn LinkedIn acquisition.
-
However, if the announced Activision Blizzard acquisition by Microsoft for $69 billion gets the green light from regulators, Microsoft will have to get new debt on its balance sheet to finance it.
💰 How much cash does Microsoft have?
Microsoft had $105 billion in cash and marketable securities on its balance sheet in 2022, down by $26bn from a year earlier. Only $8 billion was actual cash on hand, and most of the rest was in highly liquid government securities. A smaller part was in corporate debt securities.
- Microsoft’s cash pile was stable for several years. In 2022 it decreased by $26 billion to $105 billion, mainly as a result of Nuance acquisition ($18.8bn). Microsoft did not raise any debt to finance it.
⚪ What else should you know about Microsoft’s balance sheet?
A balance sheet of technology & software companies like Microsoft does not show the most valuable part of their business. What I mean is that it does not show Microsoft’s core asset, which is the intellectual property of internally developed software.
Microsoft’s Balance Sheet
| 2020 | 2021 | 2022 | Δ | %Δ | |
|---|---|---|---|---|---|
| Cash and cash equivalents | 13.6 | 14.2 | 13.9 | -0.3 | -2% |
| Short-term investments | 123.0 | 116.1 | 90.8 | -25.3 | -22% |
| Accounts receivable (net) | 32.0 | 38.0 | 44.3 | +6.2 | +16% |
| Other current assets | 13.4 | 16.0 | 20.7 | +4.6 | +29% |
| Equity and other invest. | 3.0 | 6.0 | 6.9 | +0.9 | +15% |
| Property and equipment, net | 44.2 | 59.7 | 74.4 | +14.7 | +25% |
| Operating lease assets | 8.8 | 11.1 | 13.1 | +2.1 | +19% |
| Goodwill | 43.4 | 49.7 | 67.5 | +17.8 | +36% |
| Intangible assets | 7.0 | 7.8 | 11.3 | +3.5 | +45% |
| Other long-term assets | 13.1 | 15.1 | 21.9 | +6.8 | +45% |
| Total assets | 301.3 | 333.8 | 364.8 | +31.1 | +9% |
| Accounts payable | 12.5 | 15.2 | 19.0 | +3.8 | +25% |
| Short-term debt | - | - | - | ||
| Current portion of long-term debt | 3.7 | 8.1 | 2.7 | -5.3 | -66% |
| Current portion of lease liab. | 2.2 | 2.8 | 3.3 | +0.5 | +19% |
| Other current liabilities | 53.9 | 62.7 | 70.0 | +7.4 | +12% |
| Long-term debt | 59.6 | 50.1 | 47.0 | -3.0 | -6% |
| Long-term lease liabilities | 16.6 | 21.4 | 25.3 | +4.0 | +18% |
| Other long-term liabilities | 34.5 | 31.7 | 30.9 | -0.8 | -3% |
| Total equity | 118.3 | 142.0 | 166.5 | +24.6 | +17% |
| Total liabilities and equity | 301.3 | 333.8 | 364.8 | +31.1 | +9% |
📚 Resources & Links
Related Articles I Recommend
- How Does Microsoft Make Money: Business Model Explained
- Deep dive into how Microsoft makes money and how its business model works
- Microsoft Revenue Breakdown
- A detailed breakdown of Microsoft’s revenue by product, segment and geography
- Who Owns Microsoft: The Largest Shareholders Overview
- Overview of who owns Microsoft and who controls it. With a list of the largest shareholders and how much is each of their stake worth.
Other Resources
- Microsoft’s Annual Financials Statements 2022 (K-10)
- Microsoft’s Earnings Call from July 2022
- Microsoft’s Investor Relation website
- Official Microsoft Blog
Disclaimers
- Although I use third-party trademarks and logos in this article and its visuals, kamilfranek.com is an independent site, and there is no relationship, sponsorship, or endorsement between this site and the owners of those trademarks.
- At the time of writing this article, I had a long position in Microsoft.