
Microsoft Revenue Breakdown by Product, Segment and Country
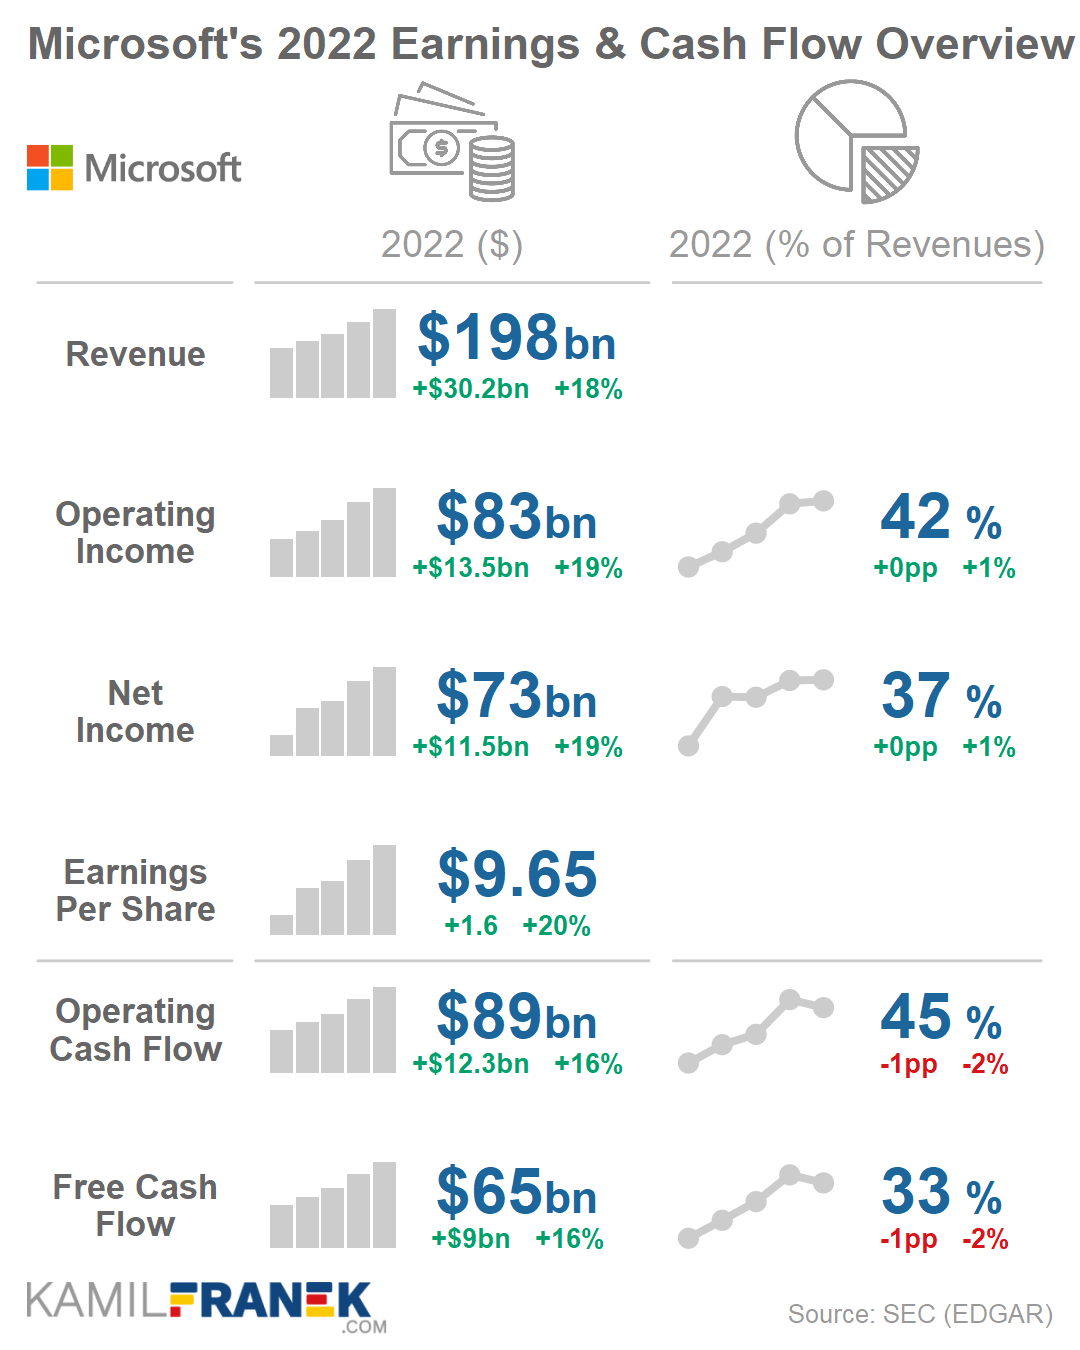
Microsoft revenue was $198 billion in 2022, up $30.2bn (+18%) from a year earlier. When we do a breakdown by product streams, the largest source of Microsoft’s revenue was Office, with $44.9 billion (23% of the total). Just behind in the second place was Azure with $44bn of revenue (22% of total).
Microsoft is exceptional in its ability to keep a big chunk of that revenue as operating income and profit. From $198 billion of revenue, Microsoft was left with $83.4 billion of operating income; from that, $72.7 billion was Microsoft’s net income after taxes.
In this article, I will focus on Microsoft’s (MSFT) revenue breakdown into different revenue streams based on product, segment, and geography and explain its revenue structure. I also wrote separate articles focusing on an overview and analysis of full Microsoft financial statements, an article about how Microsoft makes money and Microsoft’s business model, and Who Owns Microsoft. I highly recommend you check those articles if you are interested in those topics.
🔵 Microsoft Revenue Breakdown by Product
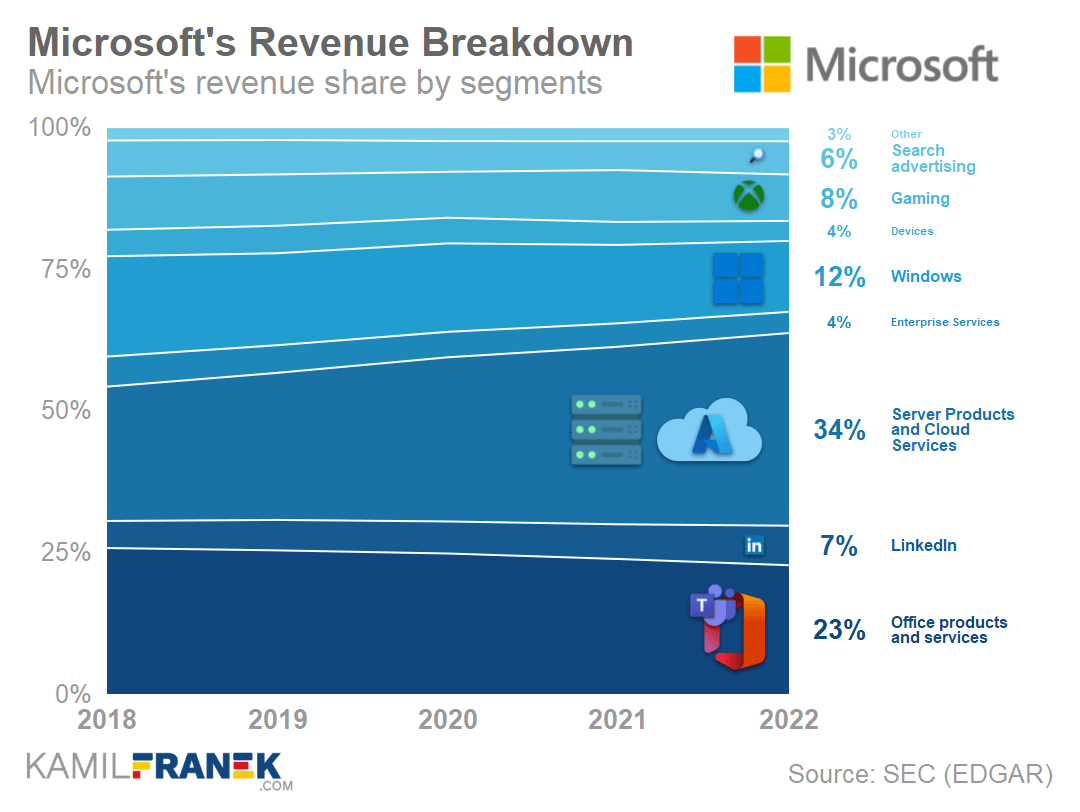
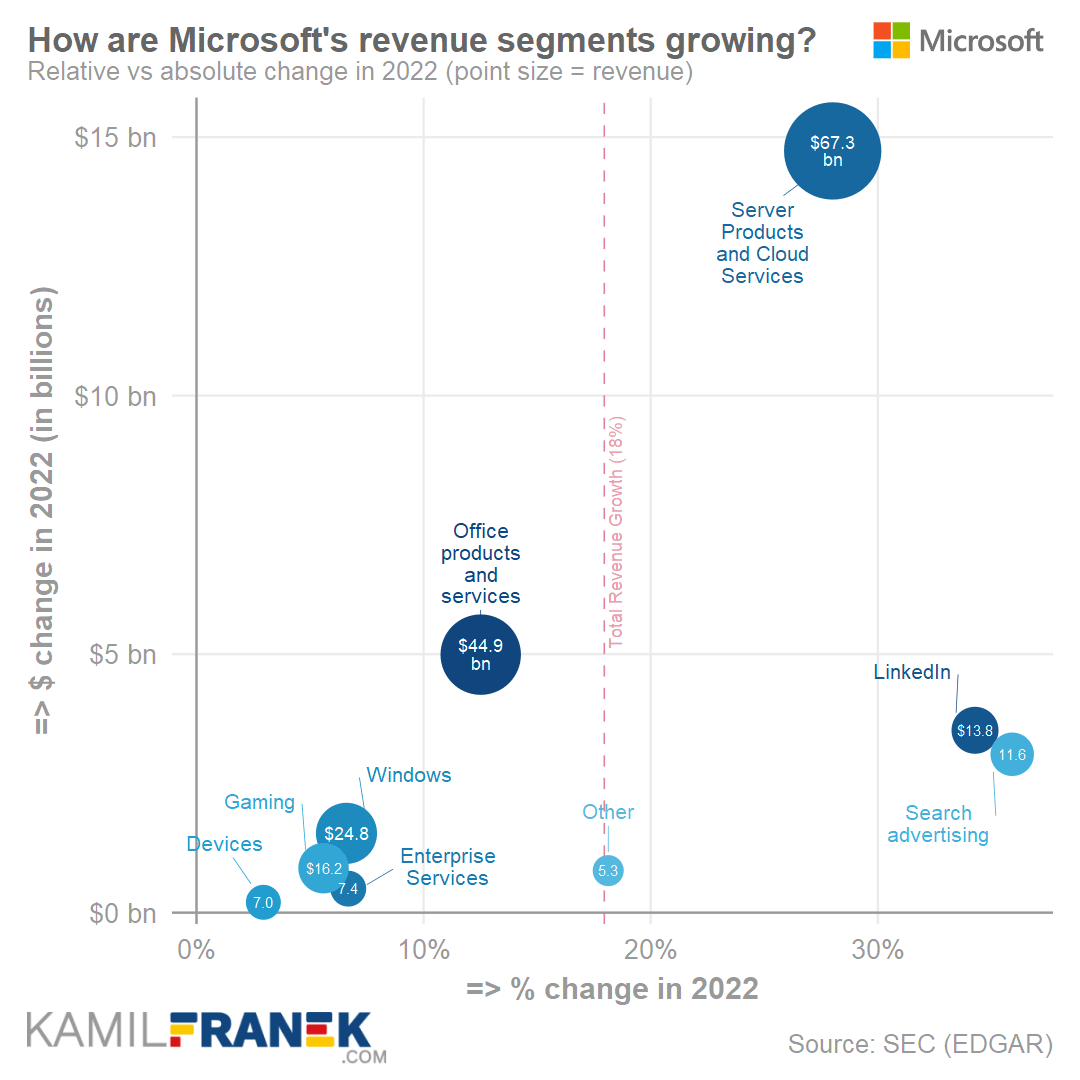
Microsoft’s largest product based revenue streams are Office products and services ($45bn of revenue / 23% of total), Azure Cloud Services ($44bn / 22% of total), Windows ($25bn / 12% of total) and Server Products ($24bn / 12% of total).
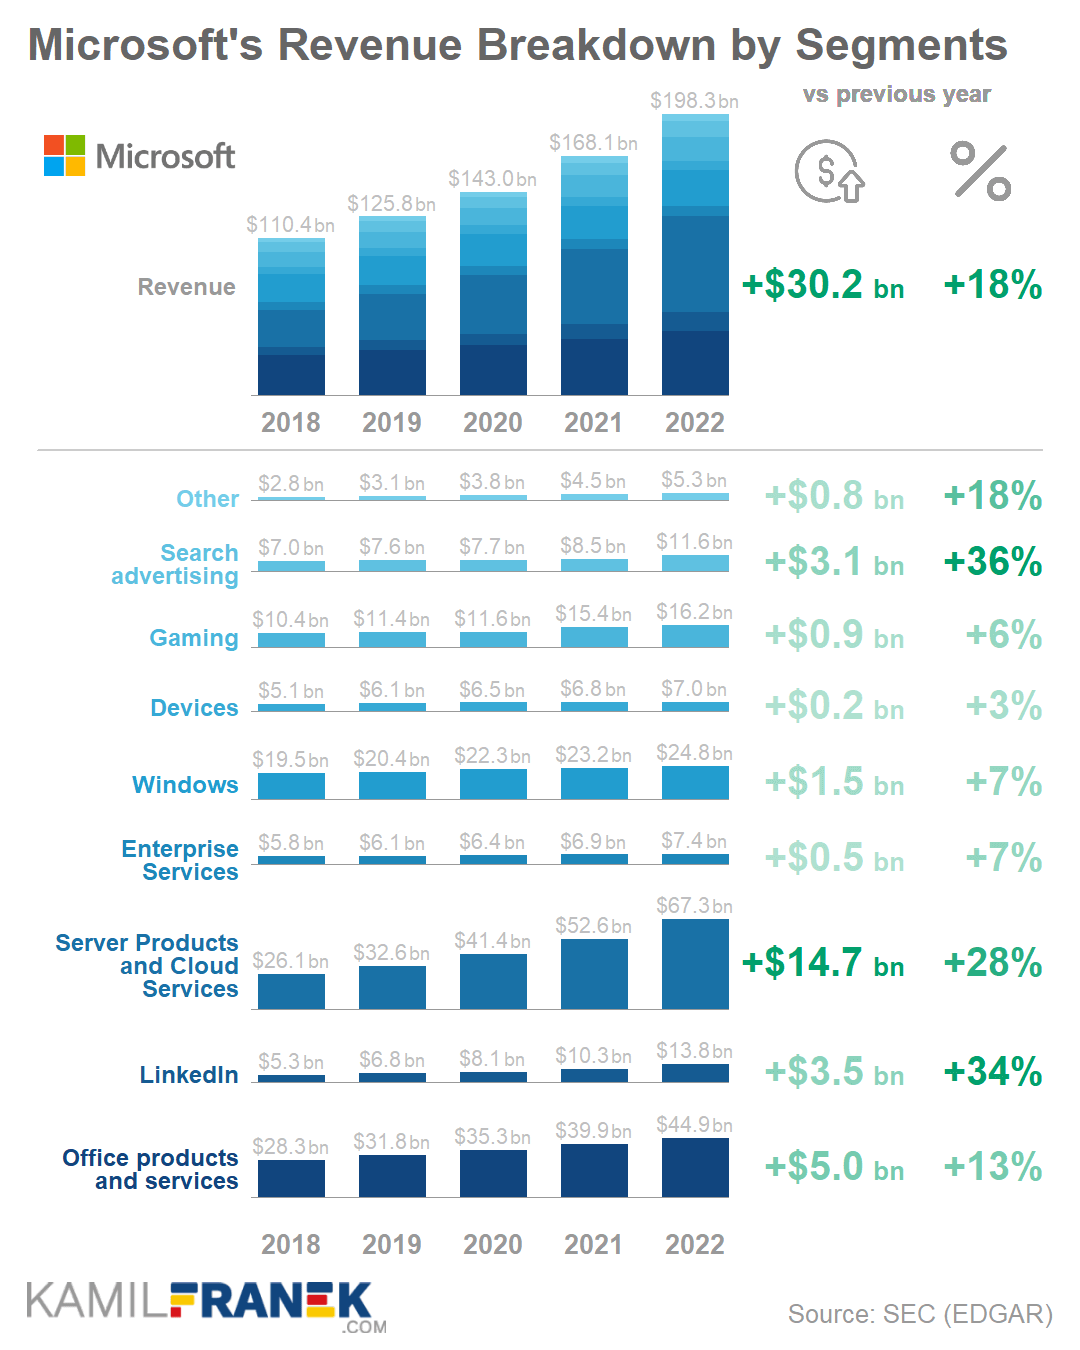
Largest contributor to +$30.2 billion of revenue growth was Azure (+$13.5bn / +45% growth), Office (+$5bn/ +13%), LinkedIn (+$3.5bn / +34%) and Search advertising (+$3.1 / +36%).
Windows and Server Products are a sizable chunk of Microsoft revenue, but those did not significantly contribute to revenue growth. Windows grew only by $1.5bn (+7%) and Server Products by $1bn (+5%).
The chart above shows Microsoft’s revenue breakdown into different product-based revenue streams as % of total revenue. The following chart below shows the absolute revenue breakdown and absolute and relative change compared to the previous period.
Note that charts combine Azure and Server products in one category, which is an official way how Microsoft presents its revenue structure by products. However, it is easy to deduce the size of Azure based on growth rates Microsoft reports.
Office product and services revenue stream (🧑💼 Productivity and business processes segment)
Office is Microsoft’s largest revenue source when broken down by product. Office earned $44.9 billion of revenue in 2022, up $5bn (+13%) compared to the previous year.
Office is Microsoft’s traditional money maker, and even though it is not experiencing fast growth as Azure or LinkedIn, its 13% growth results in significant dollar revenue growth thanks to its sheer size.
The vast majority of Office revenue comes from commercial customers. Only around $6 billion came from the consumer version of office products in 2022 (primarily Office 365).
Commercial Office 365 currently makes up the majority of total Office revenue (78% share), which grew by 18% in 2022. The reason behind this growth is not only the number of business users choosing Office 365 but also the increase in average price when customers upgrade to more expensive subscription tiers.
Microsoft Office Products and Services include a growing number of tools. Some are modern versions of classics like Outlook, Excel, Word, or PowerPoint, but some are new products that Microsoft did not have before and which got customers’ attention.
- One of the new tools is Microsoft Teams, Microsoft’s business communication tool that is becoming a platform of its own. Another one is a business intelligence tool Power BI.
Azure cloud services revenue stream (☁️ Intelligent cloud segment)
Azure cloud services are Microsoft’s second largest revenue source when broken down by product. Azure generated $44 billion in revenue in 2022, up $13.5 billion (+45%) compared to a year earlier.
Thanks to its current size and expectation of further fast growth, 2022 is the last year we can see Azure in second place in revenue. Next year, we can be nearly sure to see it as a top product revenue stream ahead of Office.
Azure is currently the engine of Microsoft’s revenue growth. Total Microsoft’s revenue increased by $30.2 billion; from that, $13.5 billion was from Azure. Azure was clearly the top revenue stream regarding contribution to revenue growth, far ahead of other revenue streams.
Microsoft is renting Azure cloud capacity to businesses. Still, it is also using Azure as a platform to build other products on top of Azure that provide better customer value and therefore justify a higher price.
In the chart in this article and Microsoft financials, you won’t find Azure separately as it is reported together with Server products as one category. However, a fairly precise estimate of its revenue is possible, thanks to other Microsoft disclosures.
Windows revenue stream (🖥️ More personal computing segment)
Microsoft Windows earned $24.8 billion of revenue in 2022, up $1.5 billion (+7%) from a year earlier. Windows was Microsoft’s third largest revenue stream. Compared to other revenue streams, Windows is growing far slower, and therefore its share of revenue has decreased for years.
Most of the Windows revenue (59% of the total) comes from licenses sold to OEM manufacturers that sell computers with Windows preinstalled.
Windows generated 12% of Microsoft’s revenue in 2022, a far smaller share than historically. It would be a mistake to interpret its decreasing revenue share as a decrease in its importance for Microsoft. Windows is still an important platform, which dominates personal computer operating systems with a 75% market share.
- When evaluating Windows’ importance for revenue, we should not forget to count on the revenue of products that would not exist without Windows. Examples of revenue streams that would hardly exist without Windows being the dominant operating system are Windows Server, Bing search advertising, and different developer tools.
- On top of that, we should also consider that there is an untapped potential to generate much more revenue and profits by fixing Microsoft problems with Edge browser and Bing Search. The market share of these products is so low that it is clearly one of the rare failures of modern Microsoft.
- My rough estimate is that Microsoft loses around $25bilion of revenue annually from Google. That includes only the personal computers market, where Windows dominates.
Windows revenue got a boost during around COVID-19 pandemic, but in the last quarter of the 2022 fiscal year, we could see OEM Windows revenue fall compared to the previous year. Still, OEMs’ revenue is higher than before the pandemic.
Server products revenue stream (☁️ Intelligent cloud segment)
Server products generated $23.7 billion of revenue in 2022, up by $1.2bn (+5%) compared to the previous year. Server products are a significant revenue stream representing 12% of Microsoft’s revenue, and it still grows in the absolute amount, although very slowly.
The main components of server product revenue are SQL Server, Windows Server, and also Visual Studio. It also includes some Nuance products that Microsoft recently acquired and GitHub revenue.
Growth of server products revenue, although slow, was driven mainly by companies utilizing hybrid solutions which combine Cloud and on-premise servers.
As I mentioned earlier, Microsoft does not report this revenue stream separately and combines it with Azure in the “Server Products and Cloud Services” product category.
Gaming revenue stream (🖥️ More personal computing segment)
Gaming earned $16.2 billion in revenue in 2022, up $0.9 (+6%) from a year earlier. Gaming revenue represents 8% of total Microsoft revenue. Nearly 80% of gaming revenue comes from Xbox content and services; the rest comes from Xbox hardware sales.
Most of the gaming revenue comes from content and services, representing mainly revenue from the digital transactions on the Xbox platform and from subscriptions like Xbox Live and Game Pass.
- Microsoft earns revenue from digital transactions by pocketing 30% of the price consumers pay for games on the Xbox console store.
- Xbox Live has around 100 million subscribers. Xbox Live is essentially a paywall for online gaming. Without it, Xbox console gamers cannot connect with other players in paid games.
- Game Pass has around 25 million subscribers, and it gives them access to hundreds of games for a monthly fee.
- Microsoft earns some revenue from hardware sales, but Microsoft is not making a profit from it.
Gaming (Xbox) is the only solely consumer-focused business Microsoft has where revenue comes directly from consumers, not businesses. In this way, gaming might seem like a weird fit for business-focused Microsoft. Still, Microsoft management is committed to pushing the Xbox platform hard, as the acquisition spree of different gaming studios of the past several years suggests.
The last gaming acquisition Microsoft announced was nothing smaller than Activision Blizzard, which Microsoft agreed to buy for $69 billion if it gets approved by regulators.
- This would significantly increase the relevance of gaming for Microsoft since standalone Activision Blizzard’s revenue was $8.8 billion in 2021.
LinkedIn revenue stream (🧑💼 Productivity and business process segment)
LinkedIn earned $13.8 billion of revenue in 2022 for Microsoft, $3.5 billion more (+34%) than the previous year. LinkedIn is only the sixth most important revenue stream representing 7% of Microsoft’s revenue. However, thanks to its fast growth, it is the third most important driver of revenue growth.
LinkedIn revenue consists of several different revenue sub-streams. The most important is Talen Solutions, which, as the name suggests, is the revenue Microsoft gets from helping companies find and hire people. It also includes LinkedIn training offerings and employee engagement tools. Microsoft earns around $6 billion annually from talent solutions.
Another important part of LinkedIn revenue is Marketing Solutions which earned over $5 billion annually, and in the last two years, marketing solution was the main driver of revenue growth.
There was a significant slowdown in LinkedIn revenue in the last fiscal quarter of 2022, influenced by a slowdown in the advertising market and in job postings.
Search advertising revenue stream (🖥️ More personal computing segment)
Search advertising generated $11.6 billion in revenue in 2022 for Microsoft, up $3.1bn (+36%) from a year earlier. It is a smaller revenue stream with a 6% share of total revenue. But it is fast-growing thanks to the digital advertising market growth in the first half of the 2022 fiscal year.
However, according to my estimates, search advertising is also a rare failure for modern Microsoft, which loses around $25bn annually. It fails to offer Windows users a good enough browsing and searching experience through its Edge and Bing products. Despite Edge and Bing being default options on Windows, most Windows users switch to competitors’ products for their browsing and searching needs, mainly to Chrome and Google Search.
Search advertising revenue growth slowed down significantly in the last quarter of the 2022 fiscal year, but it still managed to grow significantly in the full fiscal year.
Enterprise services revenue stream (☁️ Intelligent cloud segment)
Enterprise Services earned 47.4 billion of revenue in 2022 for Microsoft, up $0.5 billion (+7%) from a year earlier. It is a smaller, slow-growing revenue stream representing 4% of Microsoft’s total revenue.
It represents revenue from providing advanced support for Microsoft’s products and from consulting and training on how to best use Microsoft’s products. As a result of the Nuance acquisition, it also newly includes Nuance professional services.
Devices (Surface) revenue stream (🖥️ More personal computing segment)
Devices generated $7 billion of revenue in 2022 for Microsoft, up $0.2bn (+3%) compared to the previous year. It is a small revenue stream, representing just 4% of Microsoft’s revenue and the slowly growing one.
Most of Microsoft’s device revenue comes from selling Surface devices. Only a tiny part is revenue from PC accessories like keyboards, mice, and others that Microsoft sells under its brand.
Microsoft Revenue Breakdown by Product (Table)
| 2018 | 2019 | 2020 | 2021 | 2022 | Δ | %Δ | |
|---|---|---|---|---|---|---|---|
| Office products and services | 28.3 | 31.8 | 35.3 | 39.9 | 44.9 | +5.0 | +13% |
| 5.3 | 6.8 | 8.1 | 10.3 | 13.8 | +3.5 | +34% | |
| Server Products and Cloud Services | 26.1 | 32.6 | 41.4 | 52.6 | 67.3 | +14.7 | +28% |
| Enterprise Services | 5.8 | 6.1 | 6.4 | 6.9 | 7.4 | +0.5 | +7% |
| Windows | 19.5 | 20.4 | 22.3 | 23.2 | 24.8 | +1.5 | +7% |
| Devices | 5.1 | 6.1 | 6.5 | 6.8 | 7.0 | +0.2 | +3% |
| Gaming | 10.4 | 11.4 | 11.6 | 15.4 | 16.2 | +0.9 | +6% |
| Search advertising | 7.0 | 7.6 | 7.7 | 8.5 | 11.6 | +3.1 | +36% |
| Other | 2.8 | 3.1 | 3.8 | 4.5 | 5.3 | +0.8 | +18% |
| Revenue | 110.4 | 125.8 | 143.0 | 168.1 | 198.3 | +30.2 | +18% |
🔵 Microsoft Revenue Breakdown by Segment
Microsoft breakdowns its $198 billion of revenue into three broad segments. The largest one is the Intelligent Cloud segment, with $75.3 billion in revenue, followed closely by the Productivity and Business Process segment ($63.4bn) and the More Personal Computing segment ($59.7bn).
Intelligent Cloud segment earned $75.2 billion in revenue in 2022, up $15.2 (+25%). The main components are Azure Cloud services with $44 billion in revenue and Server products with $24 billion in revenue. The smaller part is Enterprise Services, which earned $7.4bn revenue.
Productivity and Business segment generated $63.4 billion in revenue in 2022, up $9.4bn (+18%). This segment’s components are mainly Office ($45bn of revenue) and LinkedIn ($13.8bn). It also includes revenue from [Dynamics](https://dynamics.microsoft.com/en-us/){:target=”_blank”}, (approx $5bn)
More personal computing earned $59.7 billion of revenue in 2022, up $5.6 (+10%) compared to the previous year. The main components of this segment are Windows ($24.8bn of revenue), Gaming ($16.2bn of revenue), and Search advertising ($11.6bn). It also includes devices (mostly Surface) that generate another $7bn annually.
I like the split to the first two segments mentioned above but find the “More personal computing” to be a wastebasket for everything else. It would make much more sense for Microsoft to put Gaming into its own segment and let More personal computing be a segment built around Windows and connected products like Search and devices.
🔵 Microsoft Revenue Breakdown by Geography (Country)
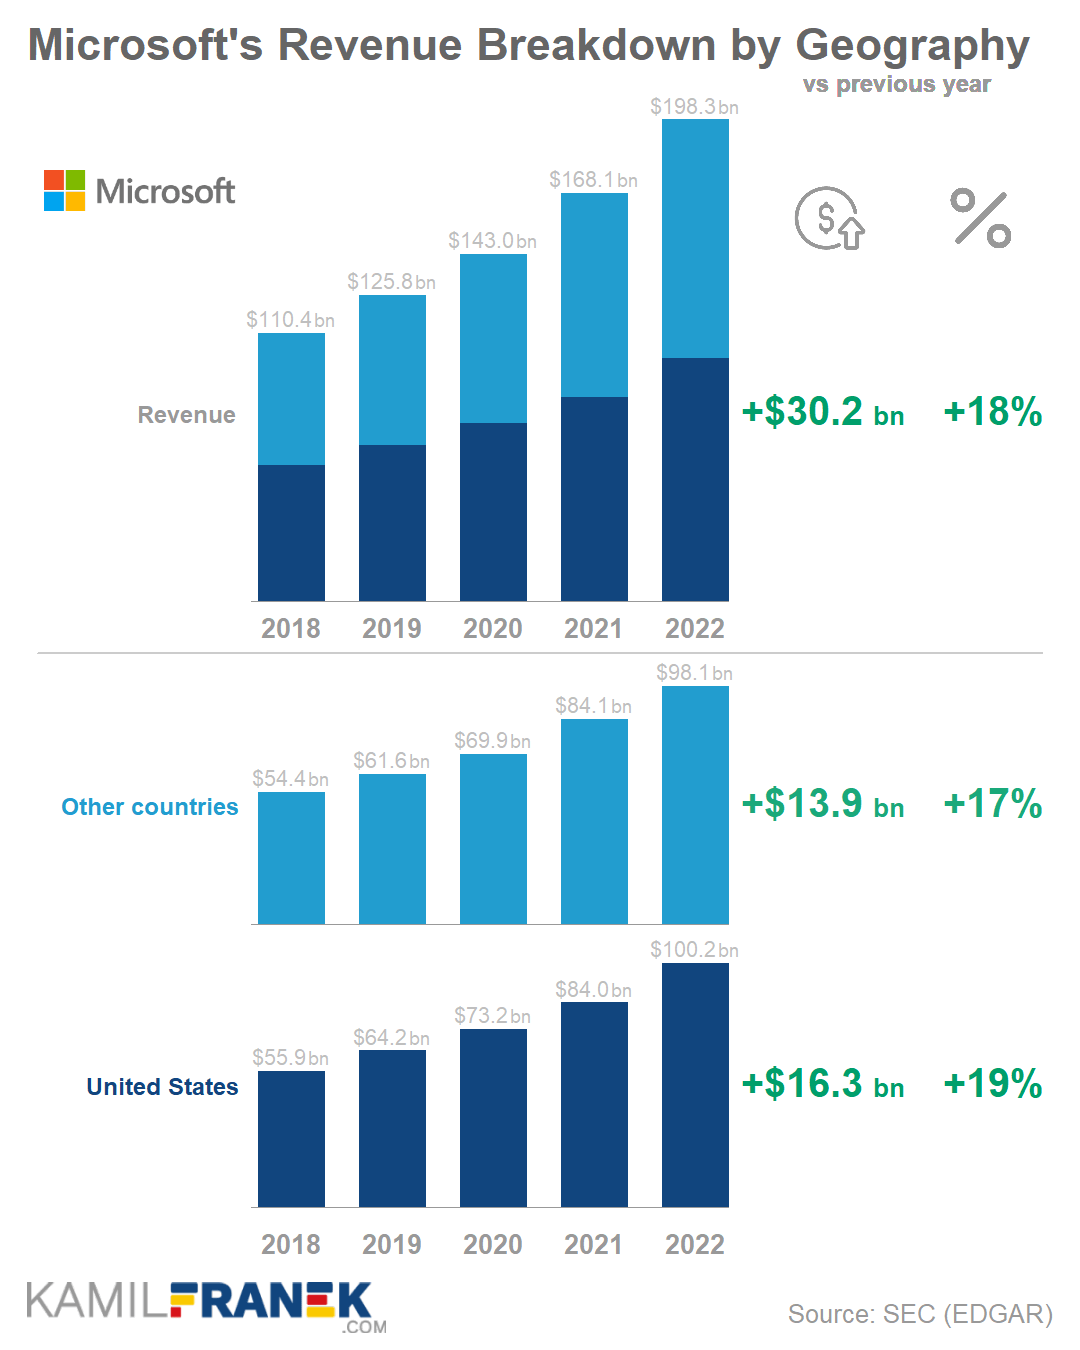
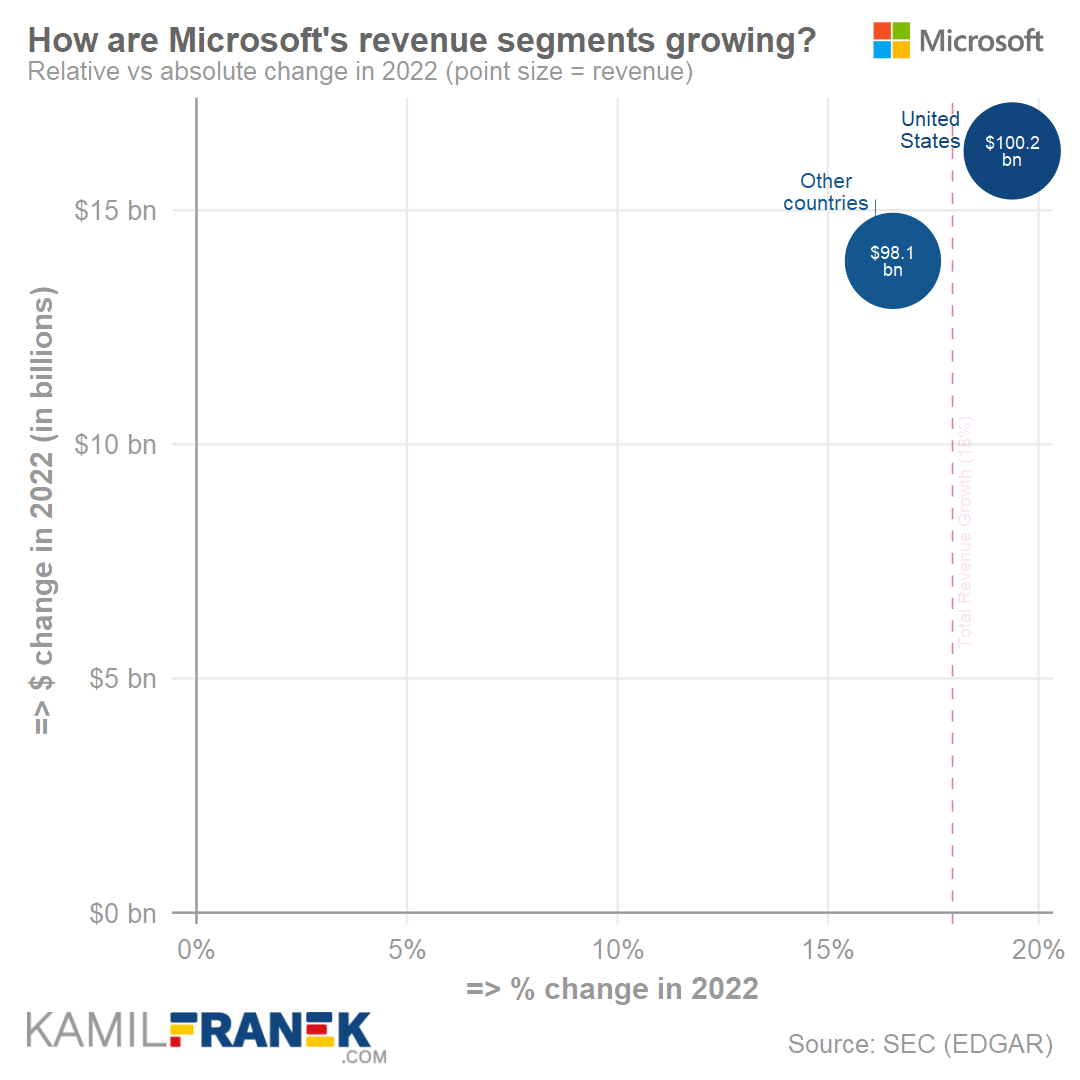
Microsoft’s $198 billion of total revenue can be broken down based on geography into revenue coming from the United States, where Microsoft earned $100 billion of revenue, and the rest of the world with $98 billion of revenue.
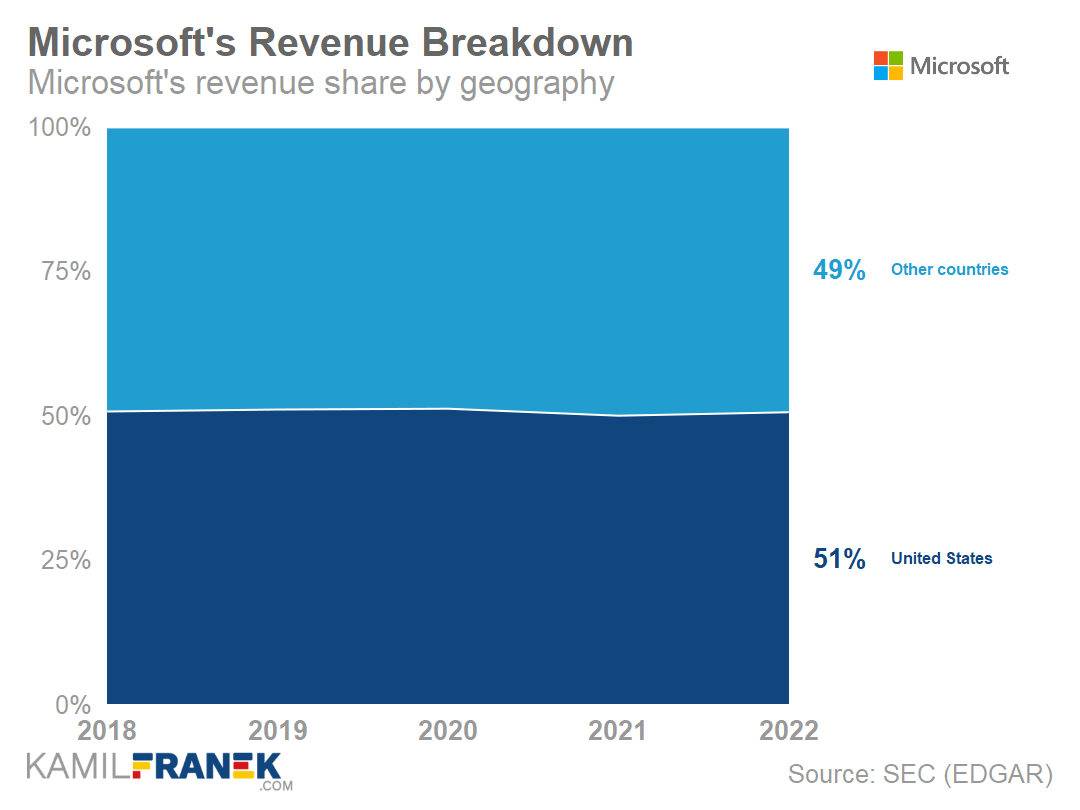
Revenue from the United States was $100.2 billion, up $16.3 billion (+19%) compared to the previous year. This represents 51% of Microsoft’s total revenue. Apart from businesses based in the US, it also includes revenue from international organizations.
Revenue from outside the US was $98.1 billion in 2022, up $13.9 billion (+17%) compared to the year earlier. Just last year, revenue from non-US countries was, for the first time, slightly higher than from the US, but it reversed in 2022.
Microsoft Revenue Breakdown by Geography (Table)
| 2018 | 2019 | 2020 | 2021 | 2022 | Δ | %Δ | |
|---|---|---|---|---|---|---|---|
| United States | 55.9 | 64.2 | 73.2 | 84.0 | 100.2 | +16.3 | +19% |
| Other countries | 54.4 | 61.6 | 69.9 | 84.1 | 98.1 | +13.9 | +17% |
| Revenue | 110.4 | 125.8 | 143.0 | 168.1 | 198.3 | +30.2 | +18% |
📚 Resources & Links
Related Articles I Recommend
- How Does Microsoft Make Money: Business Model Explained
- Deep dive into how Microsoft makes money and how its business model works
- Microsoft Financial Statements: Overview & Analysis
- Overview & analysis of the full range of financial statements with charts and visualizations.
- Who Owns Microsoft: The Largest Shareholders Overview
- Overview of who owns Microsoft and who controls it. With a list of the largest shareholders and how much is each of their stake worth.
Other Resources
- Microsoft’s Annual Financials Statements 2022 (K-10)
- Microsoft’s Earnings Call from July 2022
- Microsoft’s Investor Relation website
- Official Microsoft Blog
Disclaimers
- Although I use third-party trademarks and logos in this article and its visuals, kamilfranek.com is an independent site, and there is no relationship, sponsorship, or endorsement between this site and the owners of those trademarks.
- At the time of writing this article, I had a long position in Microsoft.