
How Does Apple Make Money: Earnings Report 2018
Apple Inc. is an iconic company with even more iconic pricing & business strategy that makes it the most profitable public company in the world. Apple is often included in one group with other technology giants. Although Apple is a technology company, it is also a matured business with huge revenue, profit and market share, but also limited growth potential.
Let me walk you through Apple’s annual report. I will start with a summary, and we will get into more detailed breakdown later.
How Does Apple Make Money - Summary
Apple made $266bn in revenue in 2018 with a growth rate of 16% compared to the previous year. Majority of Apple’s money comes from designing and selling an iPhone, and iPhone represented 63% of revenue. Apple’s dependence on the iPhone is strong, but there is some diversification. Mac, iPad, wearables and also strongly growing services brought in 37% of the revenues. That being said, when iPhone sales will get hit, Apple will feel it strongly and vice versa.
Summarized income statement for Apple, Inc.
| (in millions $) | 2016 | 2017 | 2018 | 2018 % Growth |
|---|---|---|---|---|
| Revenue | 215.6 | 229.2 | 265.6 | +16% |
| Expenses | -155.6 | -167.9 | -194.7 | +16% |
| Operating Income | 60.0 | 61.3 | 70.9 | +16% |
| Other | 1.3 | 2.7 | 2.0 | -27% |
| Taxes | -15.7 | -15.7 | -13.4 | -15% |
| Net income | 45.7 | 48.4 | 59.5 | +23% |
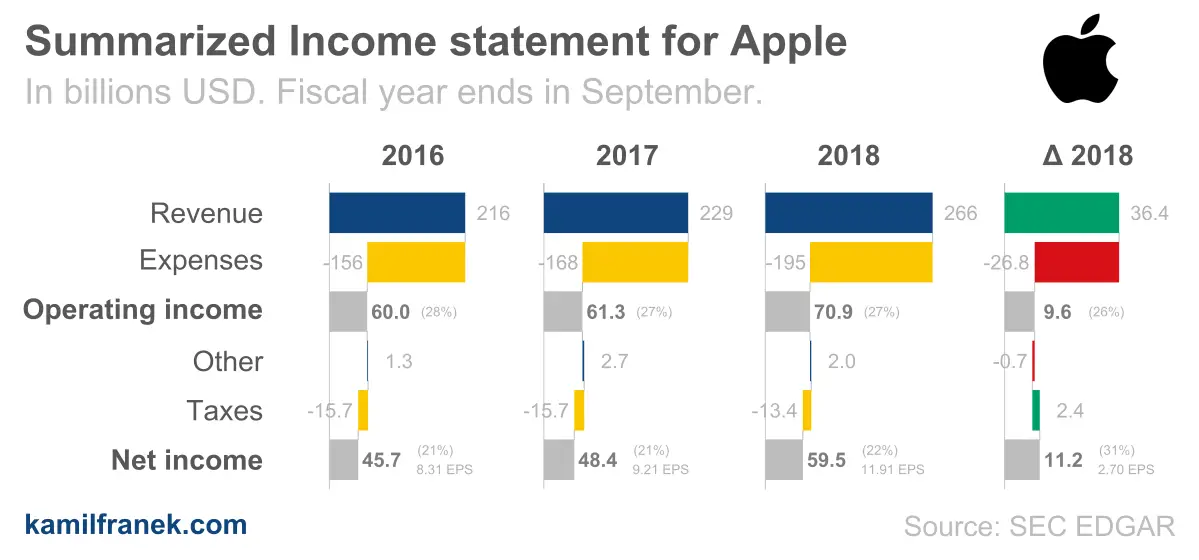
Apple again proved its dominance and ability to innovate in 2018 by significantly increasing its already enormous operating income and revenue by 16% on quite a saturated market. Sales of iPhones in units did not grow much compared to last year, but the company strategy of offering more expensive phones with higher margin paid off, at least for the time being.
Revenue and operating income of Apple was growing by 16% and net income by 23%. So what was the difference? Apple’s expenses did not cause that, because they increased in line with revenue by 16%. The reason behind net income growing more quickly than revenue is taxes that dropped significantly vs. 2017 as a result of the new Tax Code. The bottom line is that Apple increased its already enormous profit by +11bn (+23% growth vs. 2017) and earned $59.5bn in the 2018 fiscal year.
It is important to note that although Apple is strongly dependent on iPhones (63% of its revenue), it is very well diversified geographically and only 37% of its revenue is from the U.S. The rest is international. Another good news from Apple’s results is that growth in revenue is evenly spread across all regional segments.
Earnings per share (EPS) & Profit margins for Apple, Inc.
| 2016 | 2017 | 2018 | 2018 % Growth | |
|---|---|---|---|---|
| Operating margin | 28% | 27% | 27% | - |
| EPS (Earnings per share) diluted | $8.31 | $9.21 | $11.91 | +29% |
Operating margin of 27% is an amazing achievement for phone manufacturer, and even in other industries, it is hard to find companies with a higher operating margin. One of them is for example facebook with operating margin at 45%, but it is an another extreme case.
Please take into account that Apple’s fiscal year is ending in September. It means that 2018 revenue or net income for Apple that you see in its financial statements represents revenue for 12 months between October 2017 and September 2018.
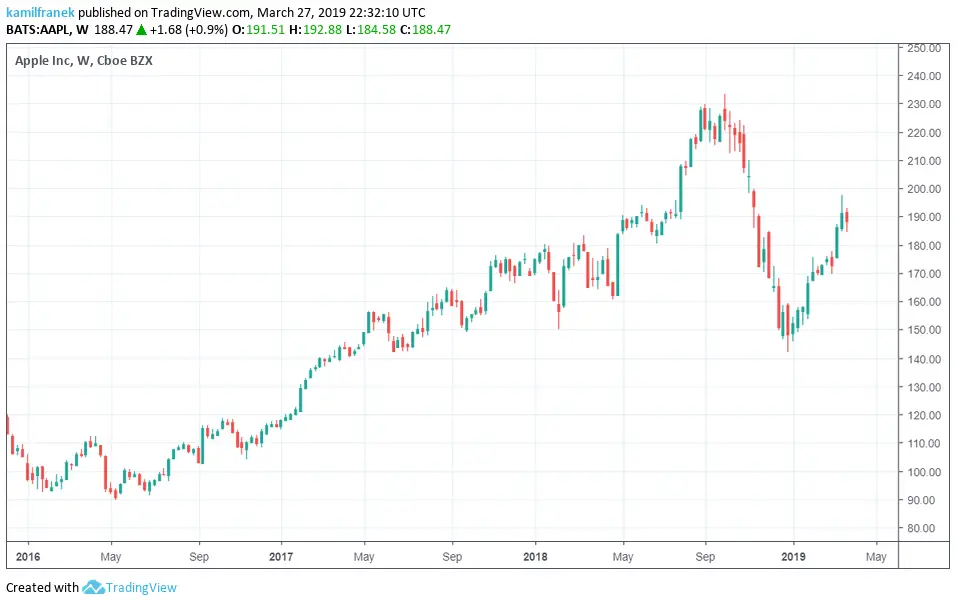
Apple (appl) stock price history over the last three years. Is Apple worth a trillion dollars?
The focus of this analysis is to review Apple’s business based on its financial statements, and I will not spend too much time talking about its stock price or its valuation. But it makes sense to show at least this chart with Apple’s stock price development over the last three years, to give you some historical context. One bar in the graph represents one week.
Apple was the first company which market capitalization got above $1 trillion. Unfortunately, it was only for three months in the second half of 2018. At the end of 2018, Apple stocks got hammered together with the rest of the market and particularly technology stocks. It’s market capitalization dropped to $0.7 trillion. Since then it got to around $0.9 trillion in the first quarter of 2019.
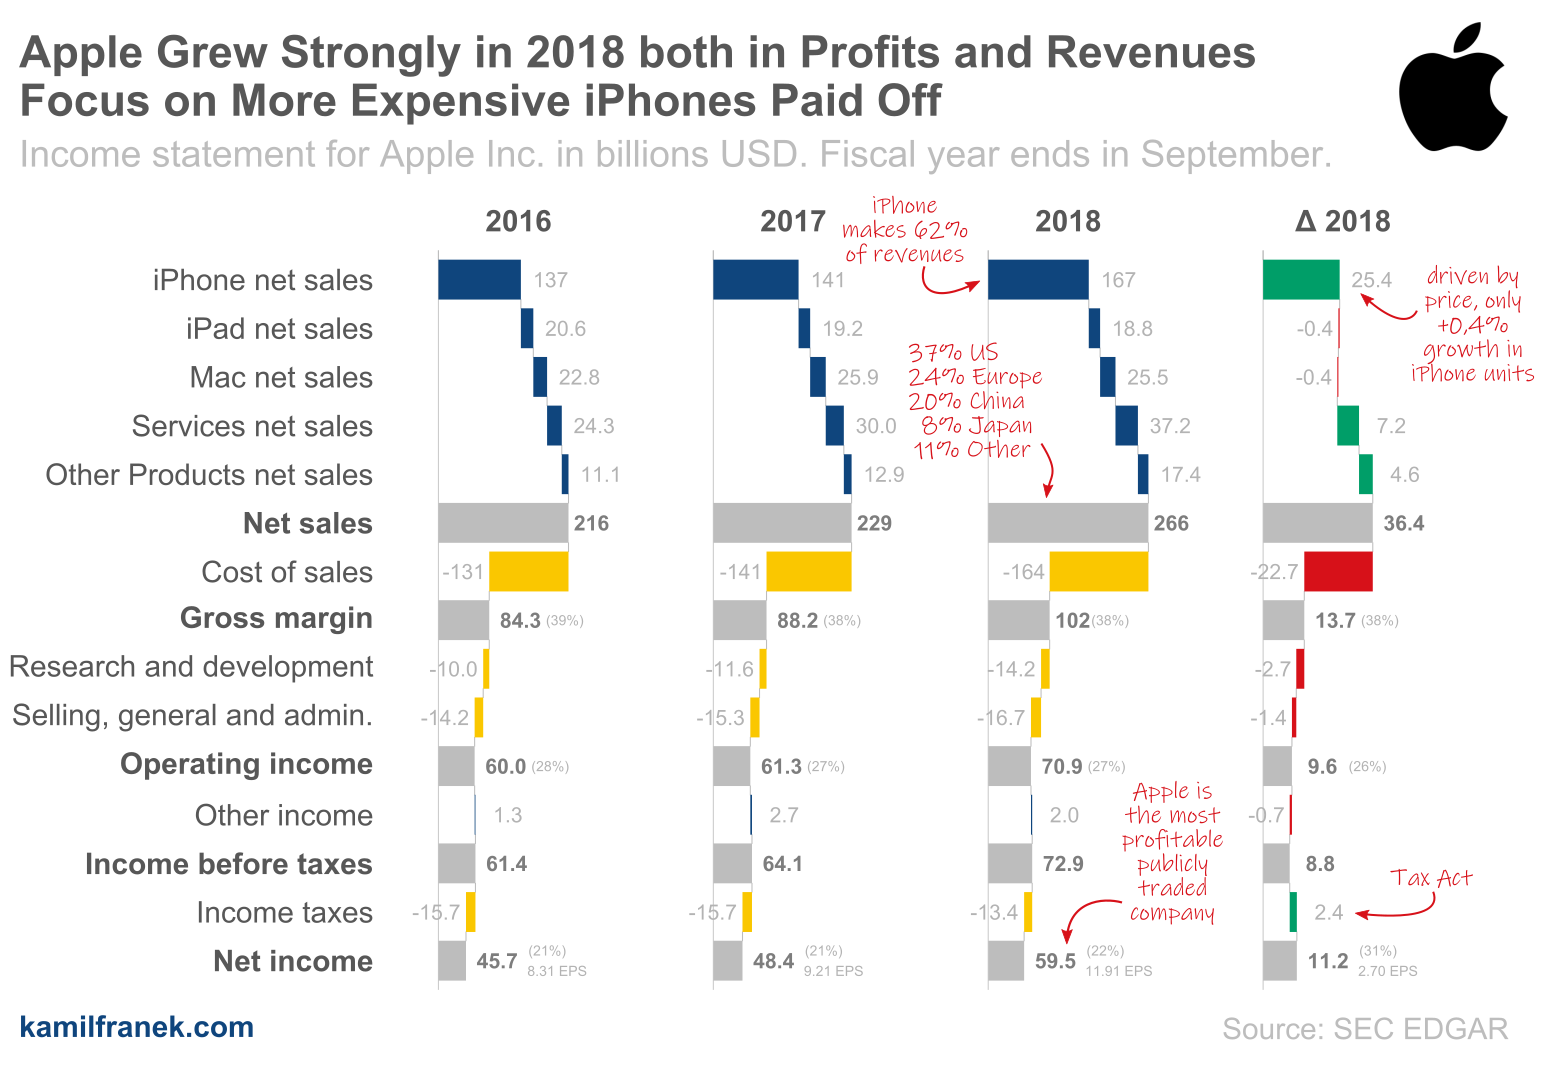
Apples’s Income Statement Visualization
The following waterfall chart is a more detailed visualization of the P&L for Apple and should help you understand the proportion between different items and highlight the main changes compared to the previous year. Below the chart, I will walk you through Apple’s P&L and show you a more detailed breakdown.
If you haven’t encountered this P&L format before and are not familiar with it, I recommend going through my post explaining how and why I prefer to show P&L statement in this form.
How Does Apple Generate Revenue: Revenue Breakdown
Apple’s revenue increased by 16% (+$36.4bn) in 2018. Given Apple’s size, it is an amazing result. What is the core driver of this growth? It wasn’t Apple Watch and neither services that Apple’s executives like to talk about as an important revenue stream for the future.
The dominant driver behind Apples’s 2018 revenue growth was iPhone revenue, which represented 70% of revenue growth in 2018. Another critical fact is that all this iPhone revenue growth was thanks to an increase in iPhone average price because the number of sold units did not change.
The second important driver were services responsible for 20% of revenue growth.
Apple annual revenue breakdown by product.
Which Apple product makes the most money? As I mentioned before it is an iPhone and it will stay this way for some time. However, Apple has also other revenue streams that support one-third of its revenue, most promising in the near future are probably services.
| (in billions $) | 2016 | 2017 | 2018 | 2018 % Growth |
|---|---|---|---|---|
| iPhone | 136.7 | 141.3 | 166.7 | +18% |
| iPad | 20.6 | 19.2 | 18.8 | -2% |
| Mac | 22.8 | 25.9 | 25.5 | -1% |
| Services | 24.3 | 30.0 | 37.2 | +24% |
| Other products | 11.1 | 12.9 | 17.4 | +35% |
| Total | 215.6 | 229.2 | 265.6 | +16% |
Revenue from services is $37.2bn, and if you compare it with $167bn for iPhone revenue, it might seem small, but it isn’t. It is twice as much as iPad revenue and more than revenue of some large corporations.
Services contain both App Store revenue and revenues from selling content.
How many iPhones and other core products does Apple sell (Unit sales by product)
| (in millions units) | 2016 | 2017 | 2018 | 2018 % Growth |
|---|---|---|---|---|
| iPhone | 211.9 | 216.8 | 217.7 | +0% |
| iPad | 45.6 | 43.8 | 43.5 | -1% |
| Mac | 18.5 | 19.3 | 18.2 | -5% |
As you see above Apple managed to sell 218 million iPhones in 2018.
How many Apple users were there in the world in 2018?
During its Q1 earnings call Apple also disclosed the total number of active install based devices.
”.. our total active installed base devices has grown from 1.3 billion at the end of January of 2018 to 1.4 billion by the end of December reaching a new all-time high for each of the main product categories and for all five of our geographic segments”
–Tim Cook, CEO of Apple, Q1 2019 Earnings Call
What is the average selling price for iPhone, Mac and iPad.
| (in $) | 2016 | 2017 | 2018 | 2018 % Growth |
|---|---|---|---|---|
| iPhone | 645 | 652 | 766 | +17% |
| iPad | 452 | 439 | 432 | -2% |
| Mac | 1235 | 1343 | 1400 | +4% |
Notice the difference between 2018 and 2017 iPhone average selling price. Apple did not increase prices, but it offered more expensive phones to its customers. It worked, and this change earned Apple $25 billion in 2018.
Unfortunately, Apple decided that it will stop publishing units sales by product in its earnings report. It means that I will not be able to show you a table like this one anymore.
How much revenue does Apple generate in different geographic regions
Below you can see geographical revenue breakdown. What is important here is that revenue growth was equally distributed across all regions. You can also see how important China is for Apple. Nearly 20% of revenue is coming from Greater China region.
During Q4 2019 earnings call, there was a question about the possible effect of US-China relationship on iPhone sales in China. Tim’s answer was defensive, pointing to the latest results.
| (in billions $) | 2016 | 2017 | 2018 | 2018 % Growth |
|---|---|---|---|---|
| Americas | 86.6 | 96.6 | 112.1 | +16% |
| Europe | 50.0 | 54.9 | 62.4 | +14% |
| Greater China | 48.5 | 44.8 | 51.8 | +16% |
| Japan | 16.9 | 17.7 | 21.7 | +23% |
| Rest of Asia Pacific | 13.7 | 15.2 | 17.4 | +15% |
| Total | 215.6 | 229.2 | 265.6 | +16% |
Apple also discloses revenue for the U.S. separately, which was $98bn in 2018 which gives you idea how small market for Apple is Canada + South America.
How much operating income does Apple generate in different geographic regions
| (in billions $) | 2016 | 2017 | 2018 | 2018 % Growth |
|---|---|---|---|---|
| Americas | 28.2 | 30.7 | 34.9 | +14% |
| Europe | 15.3 | 16.5 | 20.0 | +21% |
| Greater China | 18.8 | 17.0 | 19.7 | +16% |
| Japan | 7.2 | 8.1 | 9.5 | +17% |
| Rest of Asia Pacific | 4.8 | 5.3 | 6.2 | +17% |
| Total | 60.0 | 61.3 | 70.9 | +16% |
Operating margin by geographic regions
| (in billions $) | 2016 | 2017 | 2018 |
|---|---|---|---|
| Americas | 33% | 32% | 31% |
| Europe | 31% | 30% | 32% |
| Greater China | 39% | 38% | 38% |
| Japan | 42% | 46% | 44% |
| Rest of Asia Pacific | 35% | 35% | 36% |
Similar to absolute operating income by geographic segments, operating margins above include only expenses directly attributable to a given geographical region. Therefore they are not comparable to the overall operating margin of 27%.
If you look at margins by geographic regions margins in Asia are significantly higher than in the Americas or Europe regions. Japan is standing out here with 44% margin.
Key highlights of Apple revenue breakdown
-
Net sales increased by $36.4 billion during 2018 (16% growth), and Apple was able to keep the same gross margin as in 2017 at 38%. The company anticipates first quarter of 2019 gross margin to be between 38.0% and 38.5%.
-
iPhone is a core product for Apple, but this year it was responsible also for the majority of revenue growth. iPhone contributed $25bn from total $36bn of revenue growth. The second most important item in terms of growth were Services. Services revenue increased vs. last year by +$7bn. Revenues form iMac and iPad slightly decreased.
-
iPhone units sold grew only by 0,4% (vs +2% last year), which means that all revenue growth for iPhone product segment is attributable to Apple’s bet on more expensive models (increase in the average price of iPhones). The company sold nearly 218 million units in 2018.⠀⠀
-
A share of iPhone on total revenue increased from 62% to 63%. A share of other products is 7% for iPad, 10% Mac and 14% for Services.
-
Good news is that revenue is growing across all geographical regions, even in China and Japan. In 2017 Japan achieved just single-digit growth and revenue in China declined.⠀
-
Currently, 37% of Apple revenue come from the US and 20% from China. Dependence on China market might mean trouble going forward, given the current foreign policy situation. ⠀
-
active installed base devices have grown from 1.3 billion at the end of January of 2018 to 1.4 billion by the end of December
How Does Apple Spend Money? (Cost & Expenses)
Looking at costs and expenses for Apple is, fortunately, quite a boring activity. Expenses increases are roughly in line with revenue growth, and also headcount growth is reasonable (+7%).
How much money and on what is Apple spending
| (in billions $) | 2016 | 2017 | 2018 | 2018 % Growth |
|---|---|---|---|---|
| Cost of sales | -131.4 | -141.0 | -163.8 | +16% |
| Research and development | -10.0 | -11.6 | -14.2 | +23% |
| Selling, general and administrative | -14.2 | -15.3 | -16.7 | +9% |
| Total Expenses | -155.6 | -167.9 | -194.7 | +16% |
How many employees does Apple have
| 2016 | 2017 | 2018 | 2018 % Growth | |
|---|---|---|---|---|
| Employees | 116,000 | 123,000 | 132,000 | +7% |
How much cash does Apple have
Although I’m focusing mainly on the income statement and not so much on Apple’s balance sheet, there is one balance sheet item that I want to look into, and that’s Apple’s cash balance and how it changed.
In the end of 2018 fiscal year (which for Apple is September 29), Apple had $237.1bn in cash. It is a decrease of 12% vs previous year. One of the drivers was that Apple in 2018 repurchase common stock of $72.7 billion compared to $32.9 in 2017.
| 2016 | 2017 | 2018 | 2018 % Growth | |
|---|---|---|---|---|
| Cash, cash equivalents and marketable securities | $237.6bn | $268.9bn | $237.1bn | -12% |
When does apple report earnings?
See below dates when Apple reported their quarterly and annual earnings reports last year. You can expect this year schedule to be very similar, although it might differ by a few days.
| Date | Report Type | Calendar Period |
|---|---|---|
| 2019-01-30 | Quarter | Q4 2018 |
| 2018-11-05 | Full Year | 2017/2018 |
| 2018-08-01 | Quarter | Q2 2018 |
| 2018-05-02 | Quarter | Q1 2018 |
| 2018-02-02 | Quarter | Q4 2017 |
| 2017-11-03 | Full Year | 2016/2017 |
Apple’s fiscal year is ending in September
2019 Outlook and Q4 2018 update
Apple’s fiscal year ends in September, so financials above do not include Q4 (July-Sep). Since I already have an update about Q1 2019 (which in calendar terms is Q4 2018) let me share the main things with you.
Result in Q4 were not so positive as the full year 2018 result mainly because overall net sales decreased compared to Q4 2017. Revenues in China decreased by $4.8bn which is a decrease of 27%. Without this decrease, revenue would be stable because a decrease in the Europe segment offset a small increase in the Americas segment.
The revenue decrease was, as you probably expect, in the iPhone product line. Other product lines including services are continuing to grow. Even iPads and Mac line are growing.
During Q1 earnings call, Apple pointed several times that although China numbers were worse than was expected based on historical data, active installed base is still growing in China and so are services.
So what is the company outlook going forward? Apple confirmed its decision to move into original content and announced that it signed a contract with Oprah. However, Apple expects that Q2 will have the same problems as Q1 and weakness in China for iPhone will continue.
So what do you think? Will Apple become trillion dollar company again in 2019?
References & Links