
Visualization of 2017 FAANG Income Statements (P&L)
FAANG is an acronym commonly used to represent five technological giants Facebook, Apple, Amazon, Netflix, and Alphabet (Google). Acronyms for a group of countries or companies are quite popular. There is the BAT, referring to top Chinese internet companies Baidu, Alibaba, and Tencent and for countries the most prominent is probably BRICS, referring to emerging economies Brazil, Russia, India, China, and South Africa.
Several weeks ago I published an article about how to visually redesign the income statement using waterfall chart and I also added a couple of examples using publicly traded companies. Between the examples were also two FAANG companies (Apple & Amazon). If you haven’t checked it out, I highly recommend it as a first step before you continue further.
This article will be about applying of what I preached previously for all five FAANG companies. Currently, I will focus only on income statement visualization and some basic overview of the main P&L dynamics for each company.
FAANG companies are technological giants, but it doesn’t mean they are similar. Quite far from that. You have income generating giant Apple with quite limited growth opportunities. There are also Amazon & Netflix that are mainly about minimum profits and lot of growth potential. Alphabet (Google) and Facebook stand somewhere between.
#1 Facebook
Facebook is a social media giant. It also owns Instagram and WhatsApp. It is hard to find a company with a higher operating margin (50% in 2017).
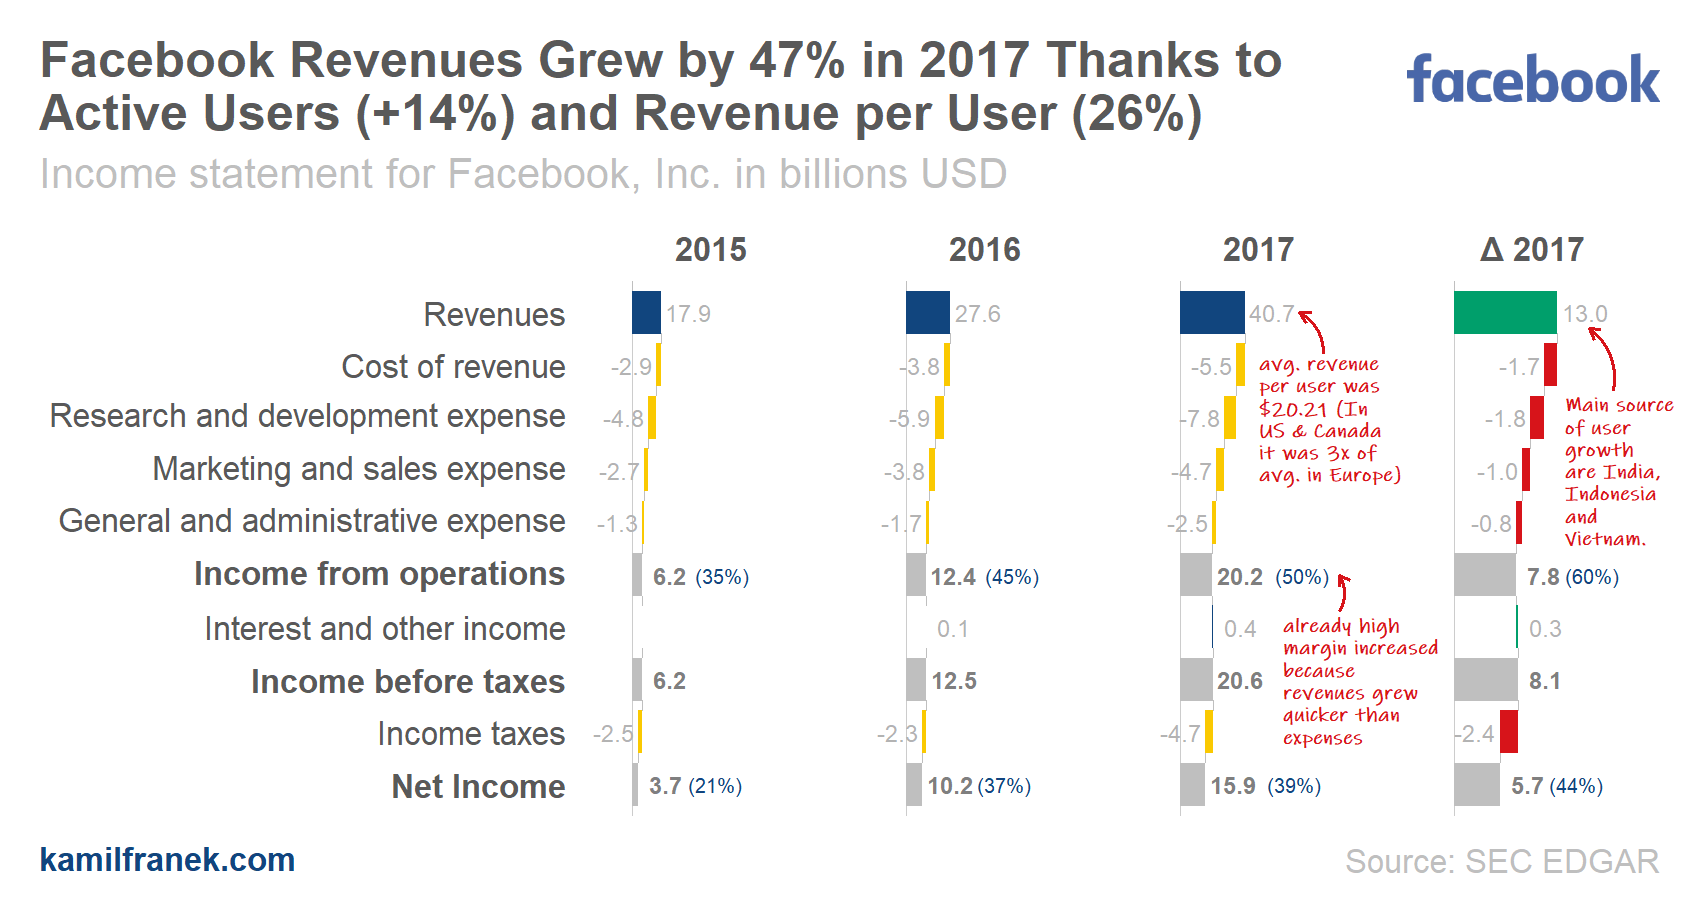
Facebook grew rapidly in 2017 both in revenues and margins which is a rare combination. Facebook achieved a 50% operating margin in 2017. Most of the revenue is from advertising.⠀
Facebook revenues grew by 47% thanks to both growth in active users (+17%) and revenue per user (+26%). ⠀
Average revenue per user was $20.21 worldwide. In US & Canada average revenue per user is roughly 4x of worldwide average. Average outside US, Canada & Europe is significantly below worldwide average. The primary sources of user growth are India, Indonesia, and Vietnam.
#2 Apple
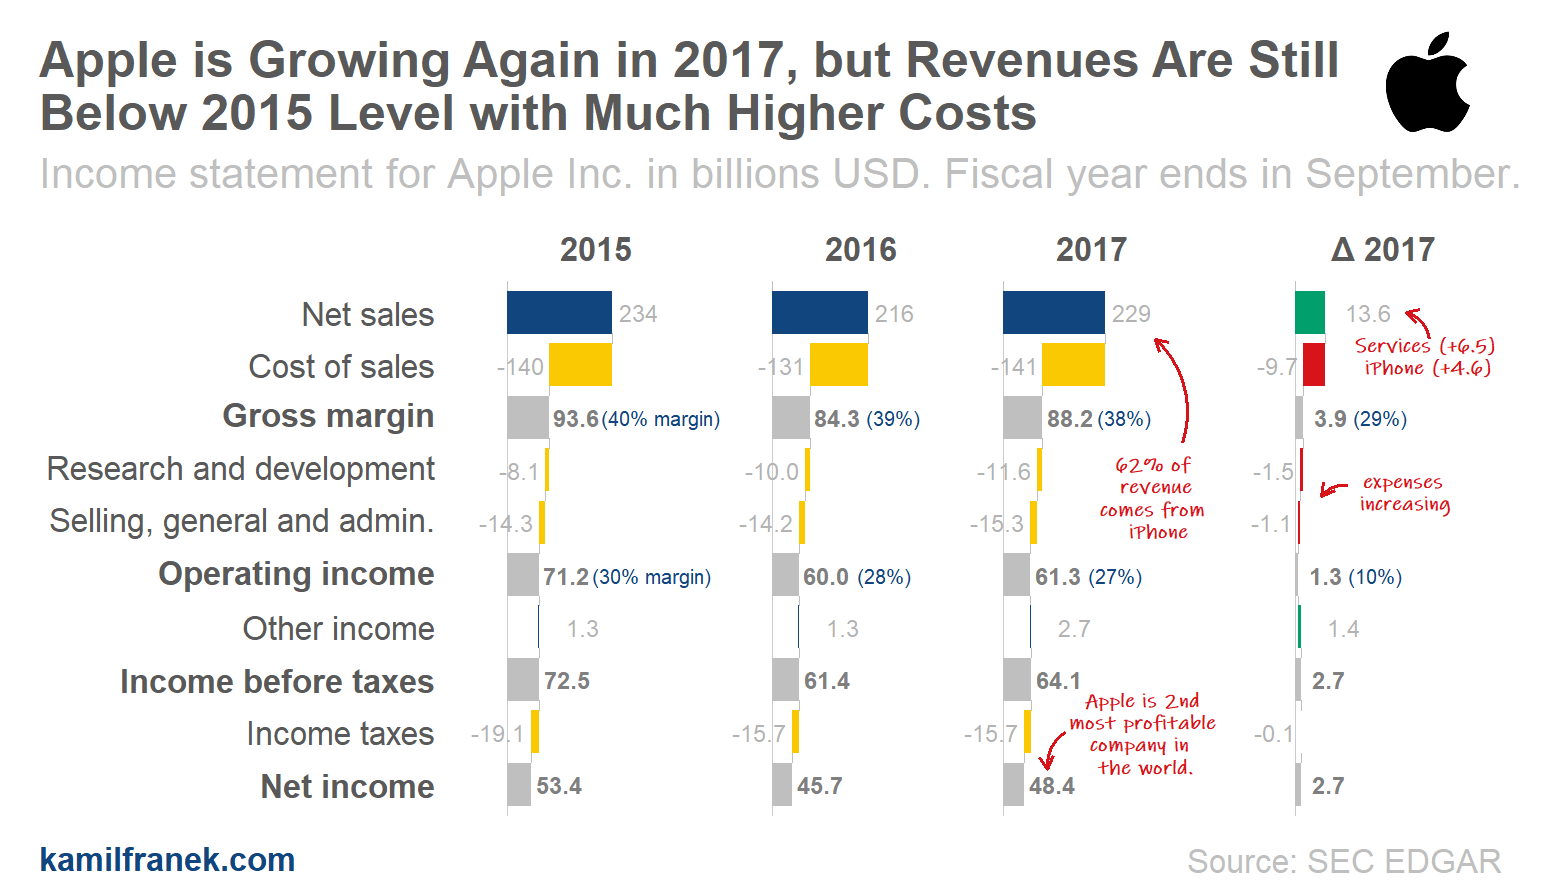
Apple is a great company and a profitable one with high margins. The first thing that will hit you in its income statement is an enormous net income line. Apple is the 2nd most profitable company in the world. (1st one is Saudi Aramco, but not by much). Apple is earning to its shareholders approximately $50bn a year.
Apple is a mature company with low expected growth rate. Recently, Apple hit $1 trillion US dollar valuation mark, and it should be no surprise for anyone. With current market P/E ratio above 20, it is just a simple multiplication exercise: $50bn of net income * 20 P/E ratio = $1 trillion. ⠀
In 2017 Apple grew by 6% ($13.6bn). In absolute term, most of this growth was coming from services (+$6.5bn) and iPhone (+$4.6bn) product line.
If you look at revenue by product line, you will find out that most of the revenue is coming from iPhone (62%). Other product lines shares are Services (13%), Mac (11%), iPad (8%), and Other (6%).
All product lines are growing by double-digits except iPhone (only 3% growth) and the only decreasing product line iPad (-7%)
#3 Amazon
Amazon is an e-commerce giant who sells hundreds of millions of products online and is also involved in other areas. Recently Amazon also bought Whole Foods Market, a US supermarket chain that specializes in organic products.
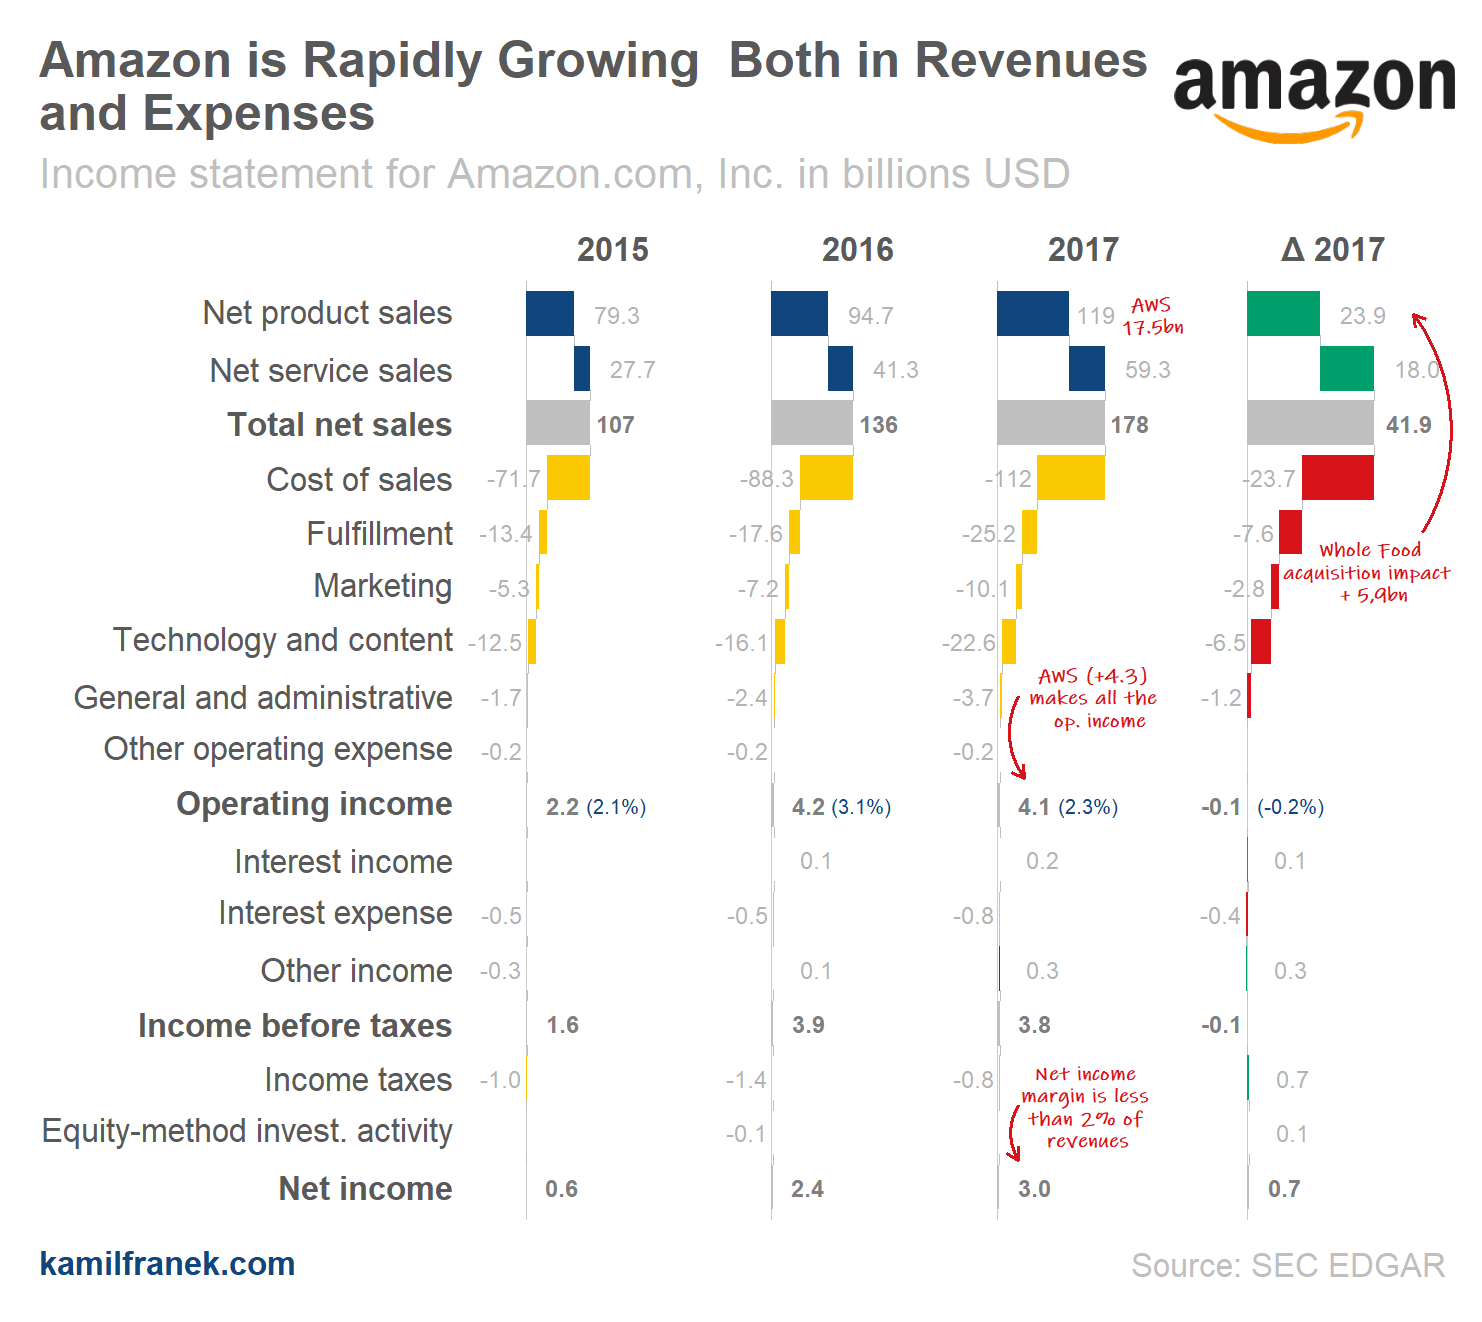
Amazon is rapidly growing both in revenues and expenses, however operating margin is still minuscule. In 2017 Amazon’s revenues (Total Net sales) were $178bn. From that 60 % were from Noth America segment, 30% from the International segment and 10% from Amazon Web Services (AWS).
If we look at operating income though, the story is different. Nearly all operating income is achieved thanks to AWS business (+$4bn). Does it mean that the e-commerce part of Amazon doesn’t earn a dime? Yes if you look at both North American and International business segment together. If you look at their financial statements closer, you will see that North America’s segment earned +$3bn and international segment lost roughly the same amount (-$3bn).
#4 Netflix
Netflix grew its revenue in 2017 by 32%. Around third of this growth was achieved by an increase in average subscription price and the rest thanks to subscribers growth.
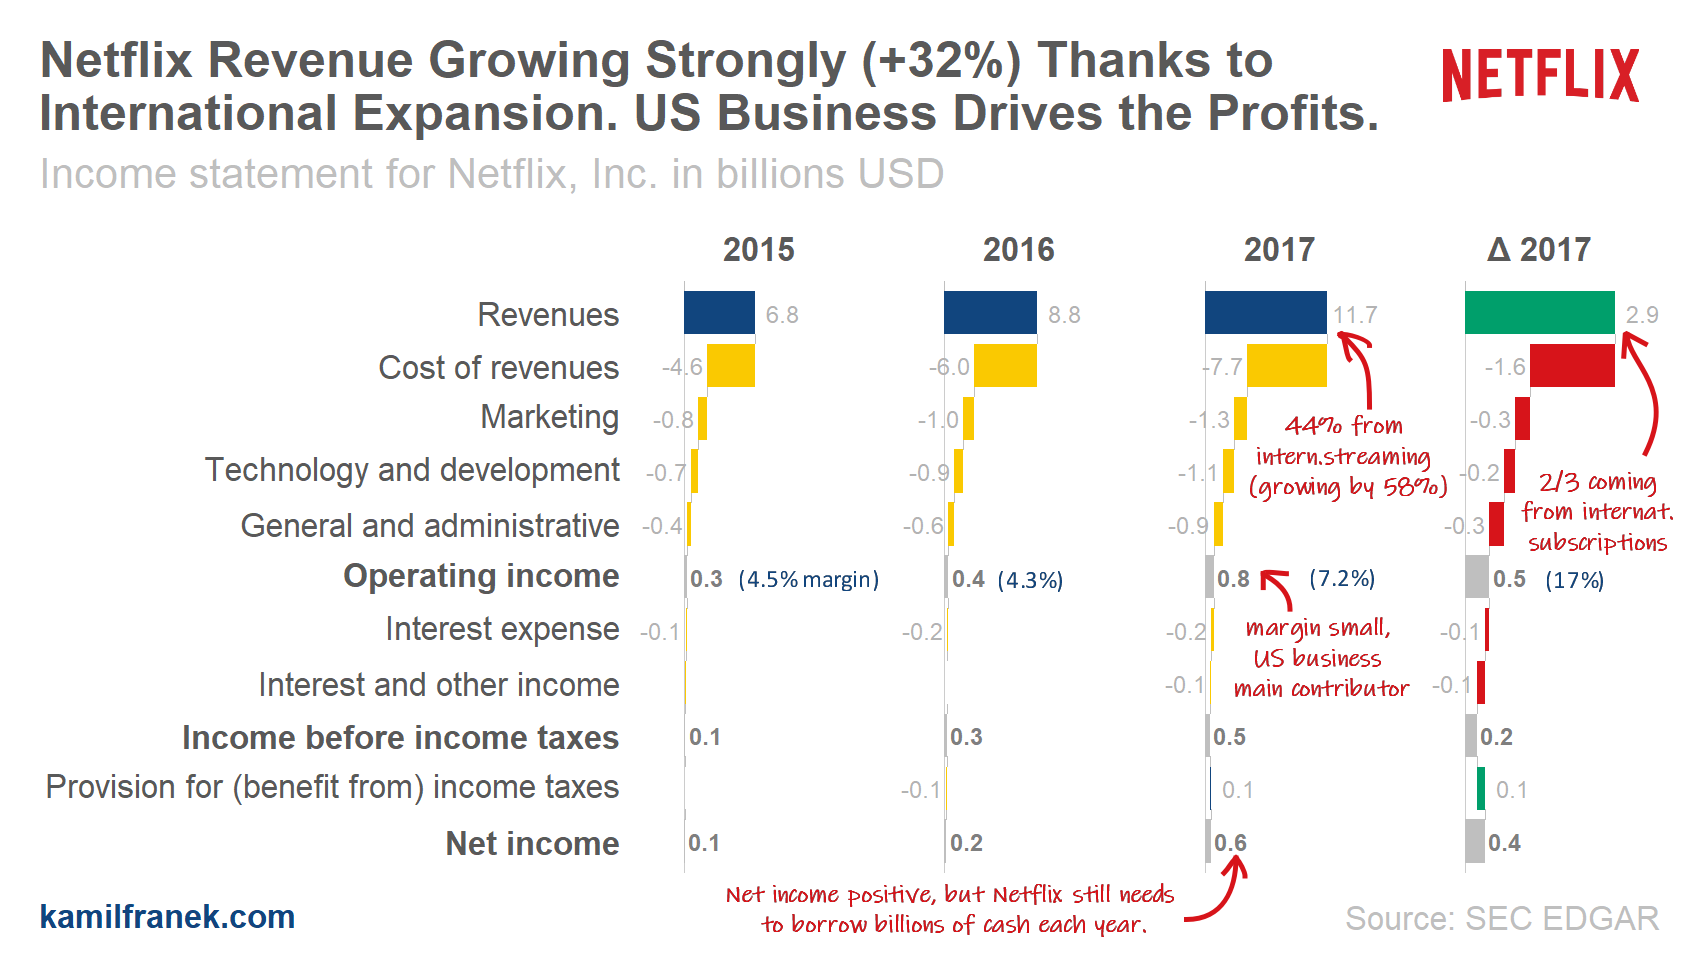
If we split Netflix revenue by segment then 53% is from US streaming (growing by 21%), 44% from international streaming (growing by 58%)⠀and the rest is legacy small DVD-by-mail service (decreasing by 17%).
Growth in average subscription price is around 10% in both US and international streaming, so the increasing number of subscriptions drive the rest of the growth. At the end of 2017, Netflix had 53m US streaming paid memberships, 58m international streaming paid memberships and 3m legacy US DVD-by-mail service. Netflix still operates its original DVD-by-mail service which is small & decreasing but high-margin business.⠀
So far it looks that the US and international segment are roughly balanced in its size. However, when you look at margins of those segments, taking into account cost of revenues and marketing costs, you will see that while US streaming service has a healthy margin of 37%, a margin of the international streaming segment was only 4% in 2017. Good news is that in 2018 we already see higher margins even for the international segment (15%).⠀
Another point to keep in mind when you are looking at Netflix P&L is that positive net income does not mean Netflix is already a self-financing business. Netflix is still burning billions of cash each year that they need to produce new content and buy licenses. Since it is amortized, so you do not see it all as cost in 2017. Therefore it needs to borrow billions each year to finance its aggressive growth.⠀
#5 Alphabet (Google)
Alphabet is a new name (since 2015) for Google and all its projects. But do not let it confuse you, Alphabet is still from 99% old Google and from 86% it relies on advertising revenues.
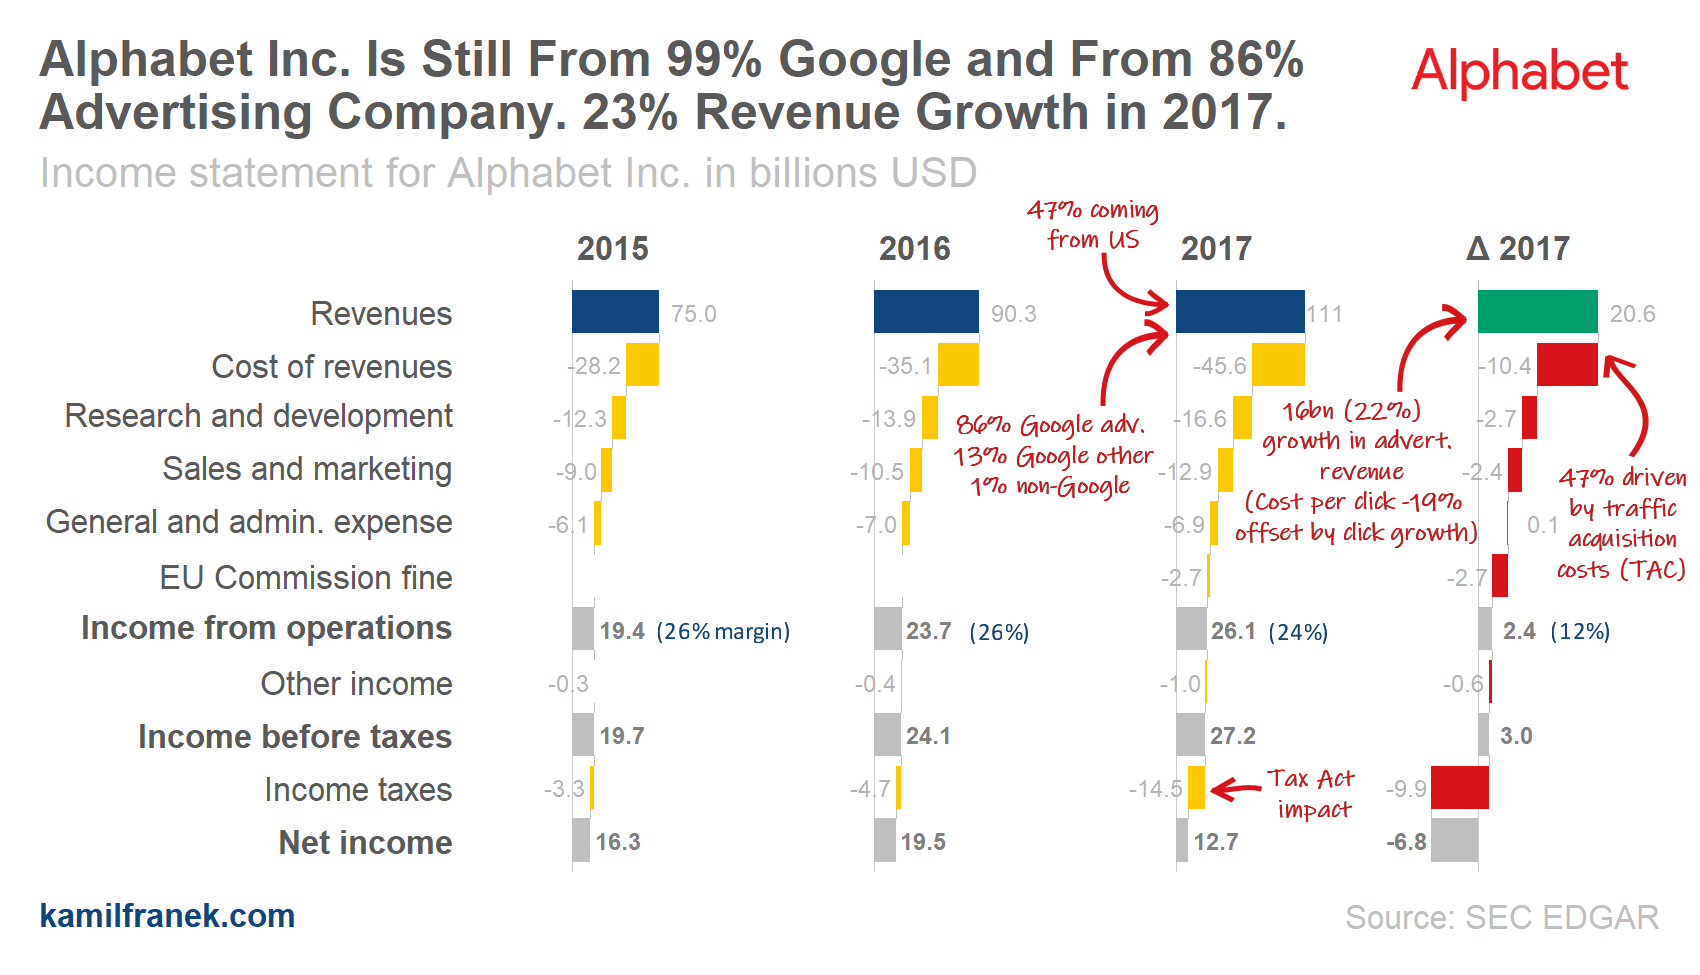
Revenues grew by 23% thanks to an increase in clicks by 46%, offset by a decrease in cost-per-click. Even though Alphabet is a global company, 47% of revenues are still coming from the US.⠀
Advertising revenues grew by 22%, other Google revenues by 42% and so far negligible non-Google projects by 49%.⠀
Operating margin decreased from 26% to 24% and Alphabet expects another decrease thanks to both increase of traffic acquisition costs (TAC) and also thanks to an increasing share of non-advertising revenues (with generally lower margin)
References: Visualizations in this article were created using R and ggplot2.