
How Census Data Can Help You to Evaluate Business Potential
A few months ago I put together a very basic overview of where people live in the Czech Republic in an article “Where do your Czech Customers live”. It was a short post with basic metrics and visualizations about what are the biggest Czech cities, where is the biggest population density and that Pareto 20/80 really works. However, I felt that I need to get back to this topic and try to go one step deeper. Suggesting that biggest businesses potential (at least for retail) is in the biggest cities by population appeared just too simplistic.
Though it might be a good rule of thumb, a larger city doesn’t always mean that it has bigger customer potential.
Characteristics of the population will vary between cities, and it is something I want to explore in this post, using the Czech Republic census data.
City population is not enough to evaluate city business potential. Or is it?
If you want to answer the question “Which city should I open my next store in?” or “From which territory should I expect more sales?” more appropriately than just looking at the population level, you would ideally want actual market sales data for your product/service in a given city. Unfortunately, that’s not always possible. There are many other data options we can incorporate as a proxy. We might look at economic activity, purchasing power, age structure, education, your competition presence, weather, etc.
I want to go deeper than before, but I will limit the scope of this post only to a subset of few essential characteristics that are included in publicly available Czech census data.
The advantage of census data is that they are available in very granular city level across a quite complete set of metrics. On the other hand, they are usually dated.
Demographic characteristics, fortunately, do not change very quickly in time, so we can still use census data for our more profound look at the Czech cities population. Another option would be to use poll numbers that are available more frequently, but not all of them have the same level of granularity and might be less accurate.
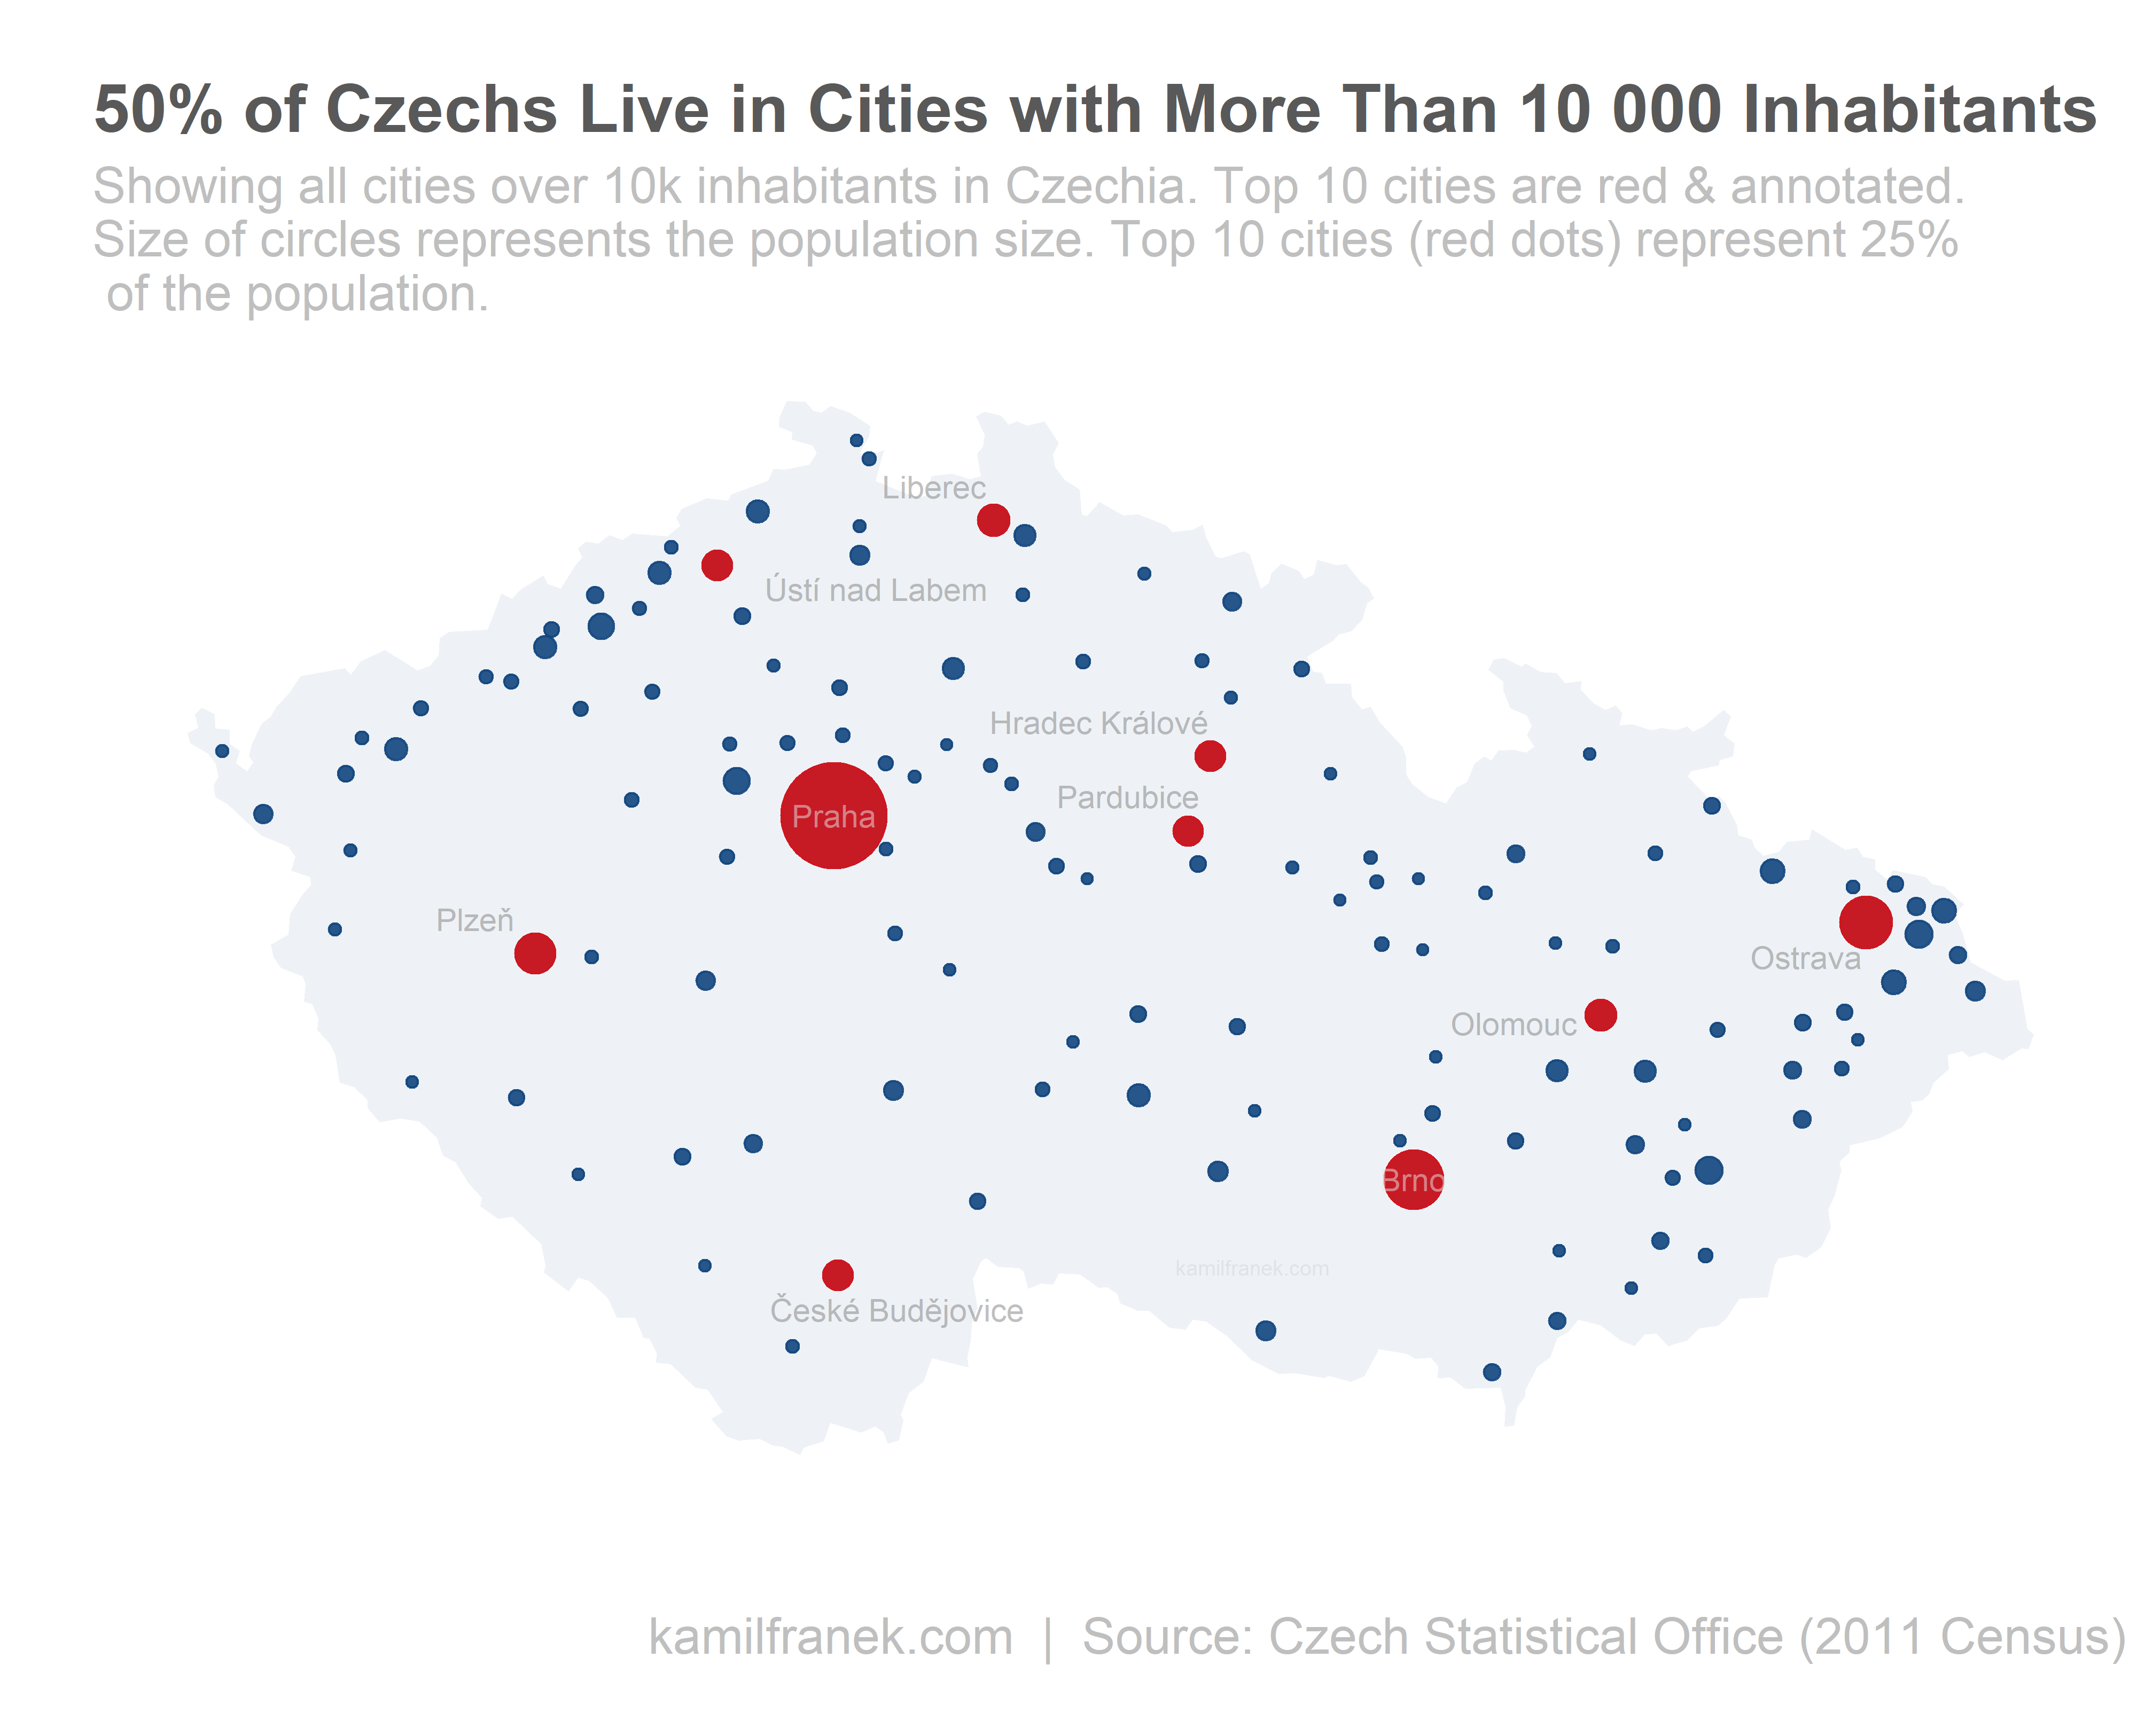
Below is a map showing cities over 10 000 population. Roughly 50% of the Czech population lives in these cities, and I highlighted the top 10 biggest ones over 90K population in red. These top 10 cities represent roughly 25% of Czechia population. These are the cities I will concentrate on.
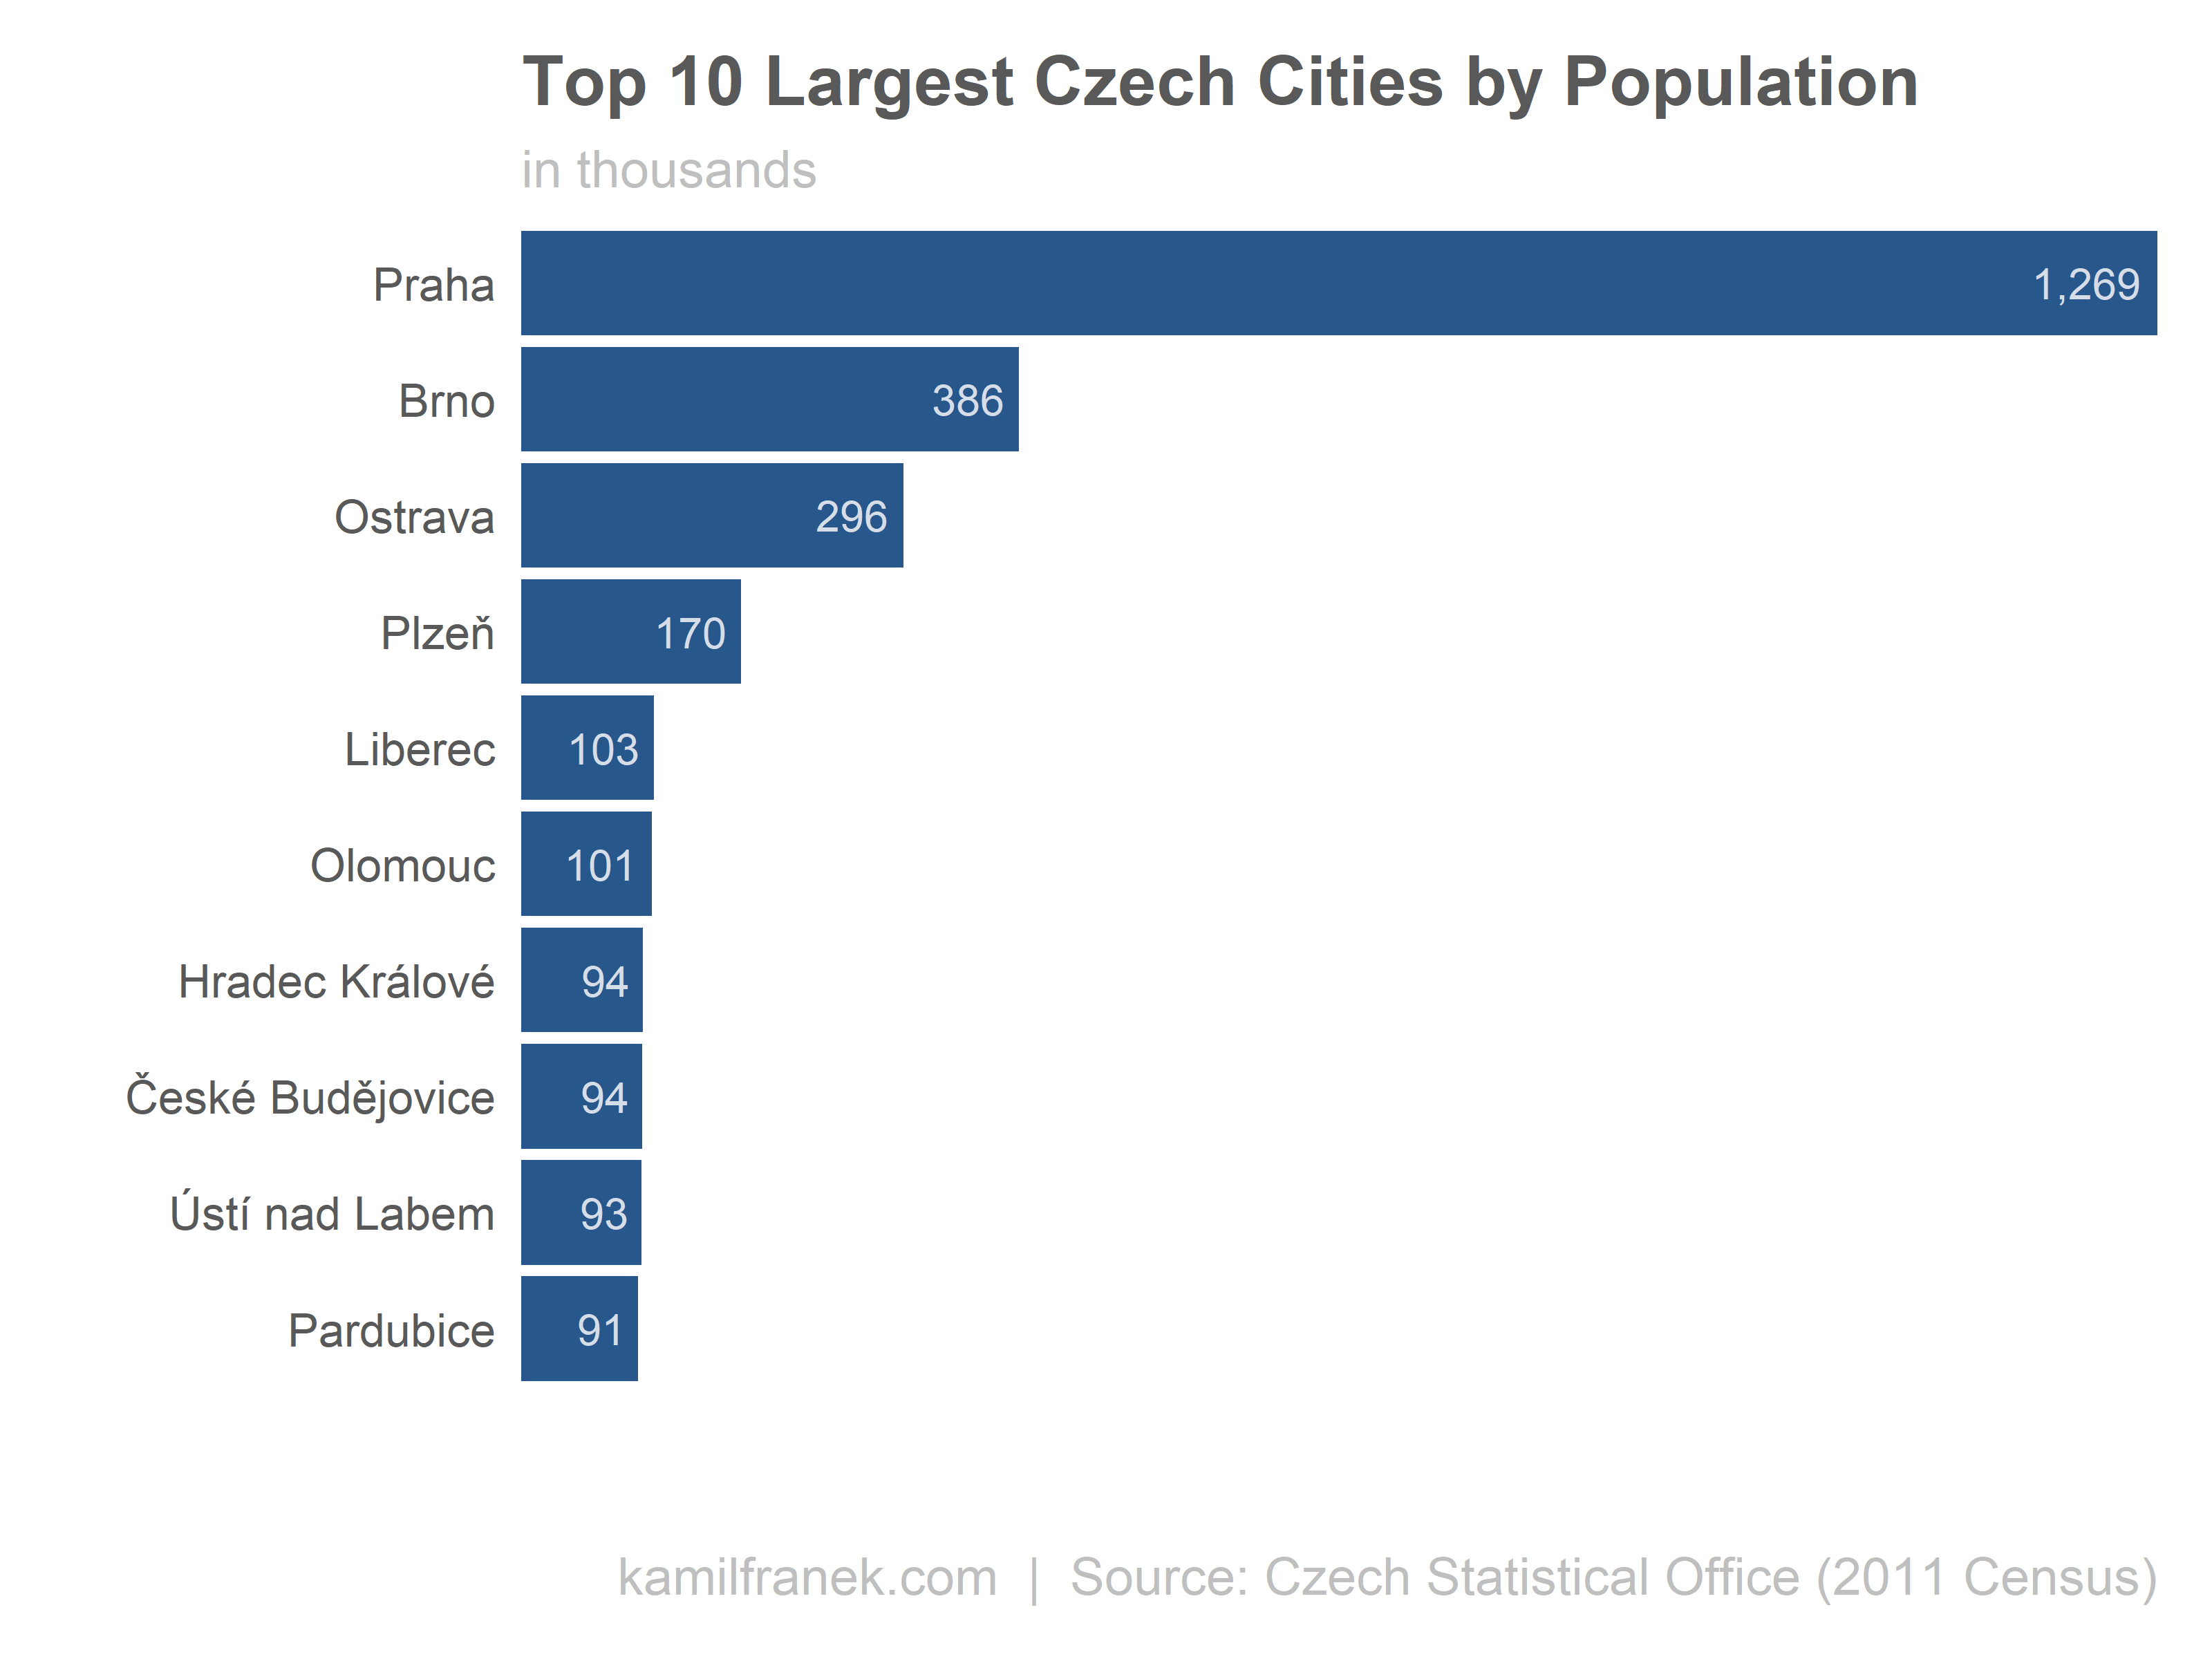
To give you a better idea of how the top cities population compares to each other, see the bar chart below. Prague is quite disproportionately large vs. the other cities. Second Brno and third Ostrava are close to each other and then there is the rest. Plzen as the fourth biggest city (yes that’s the town where that great Pilsen beer comes from :-)) is only slightly ahead of the rest of the top 10 group. All comparisons I’m going to do here will be limited to these top 10 cities.
Which relevant population characteristics from census can help you decide which cities have the biggest business potential for your company?
I picked these three characteristics that I will look at city level later but for now, let’s look at the total Czech population level.
- economic activity (Do you target to students, working populations, pensioners, entrepreneurs, employees?)
- age structure (children, teenagers or do you focus on older people?)
- education
Below see visualizations of these characteristics as total numbers for the Czech Republic.
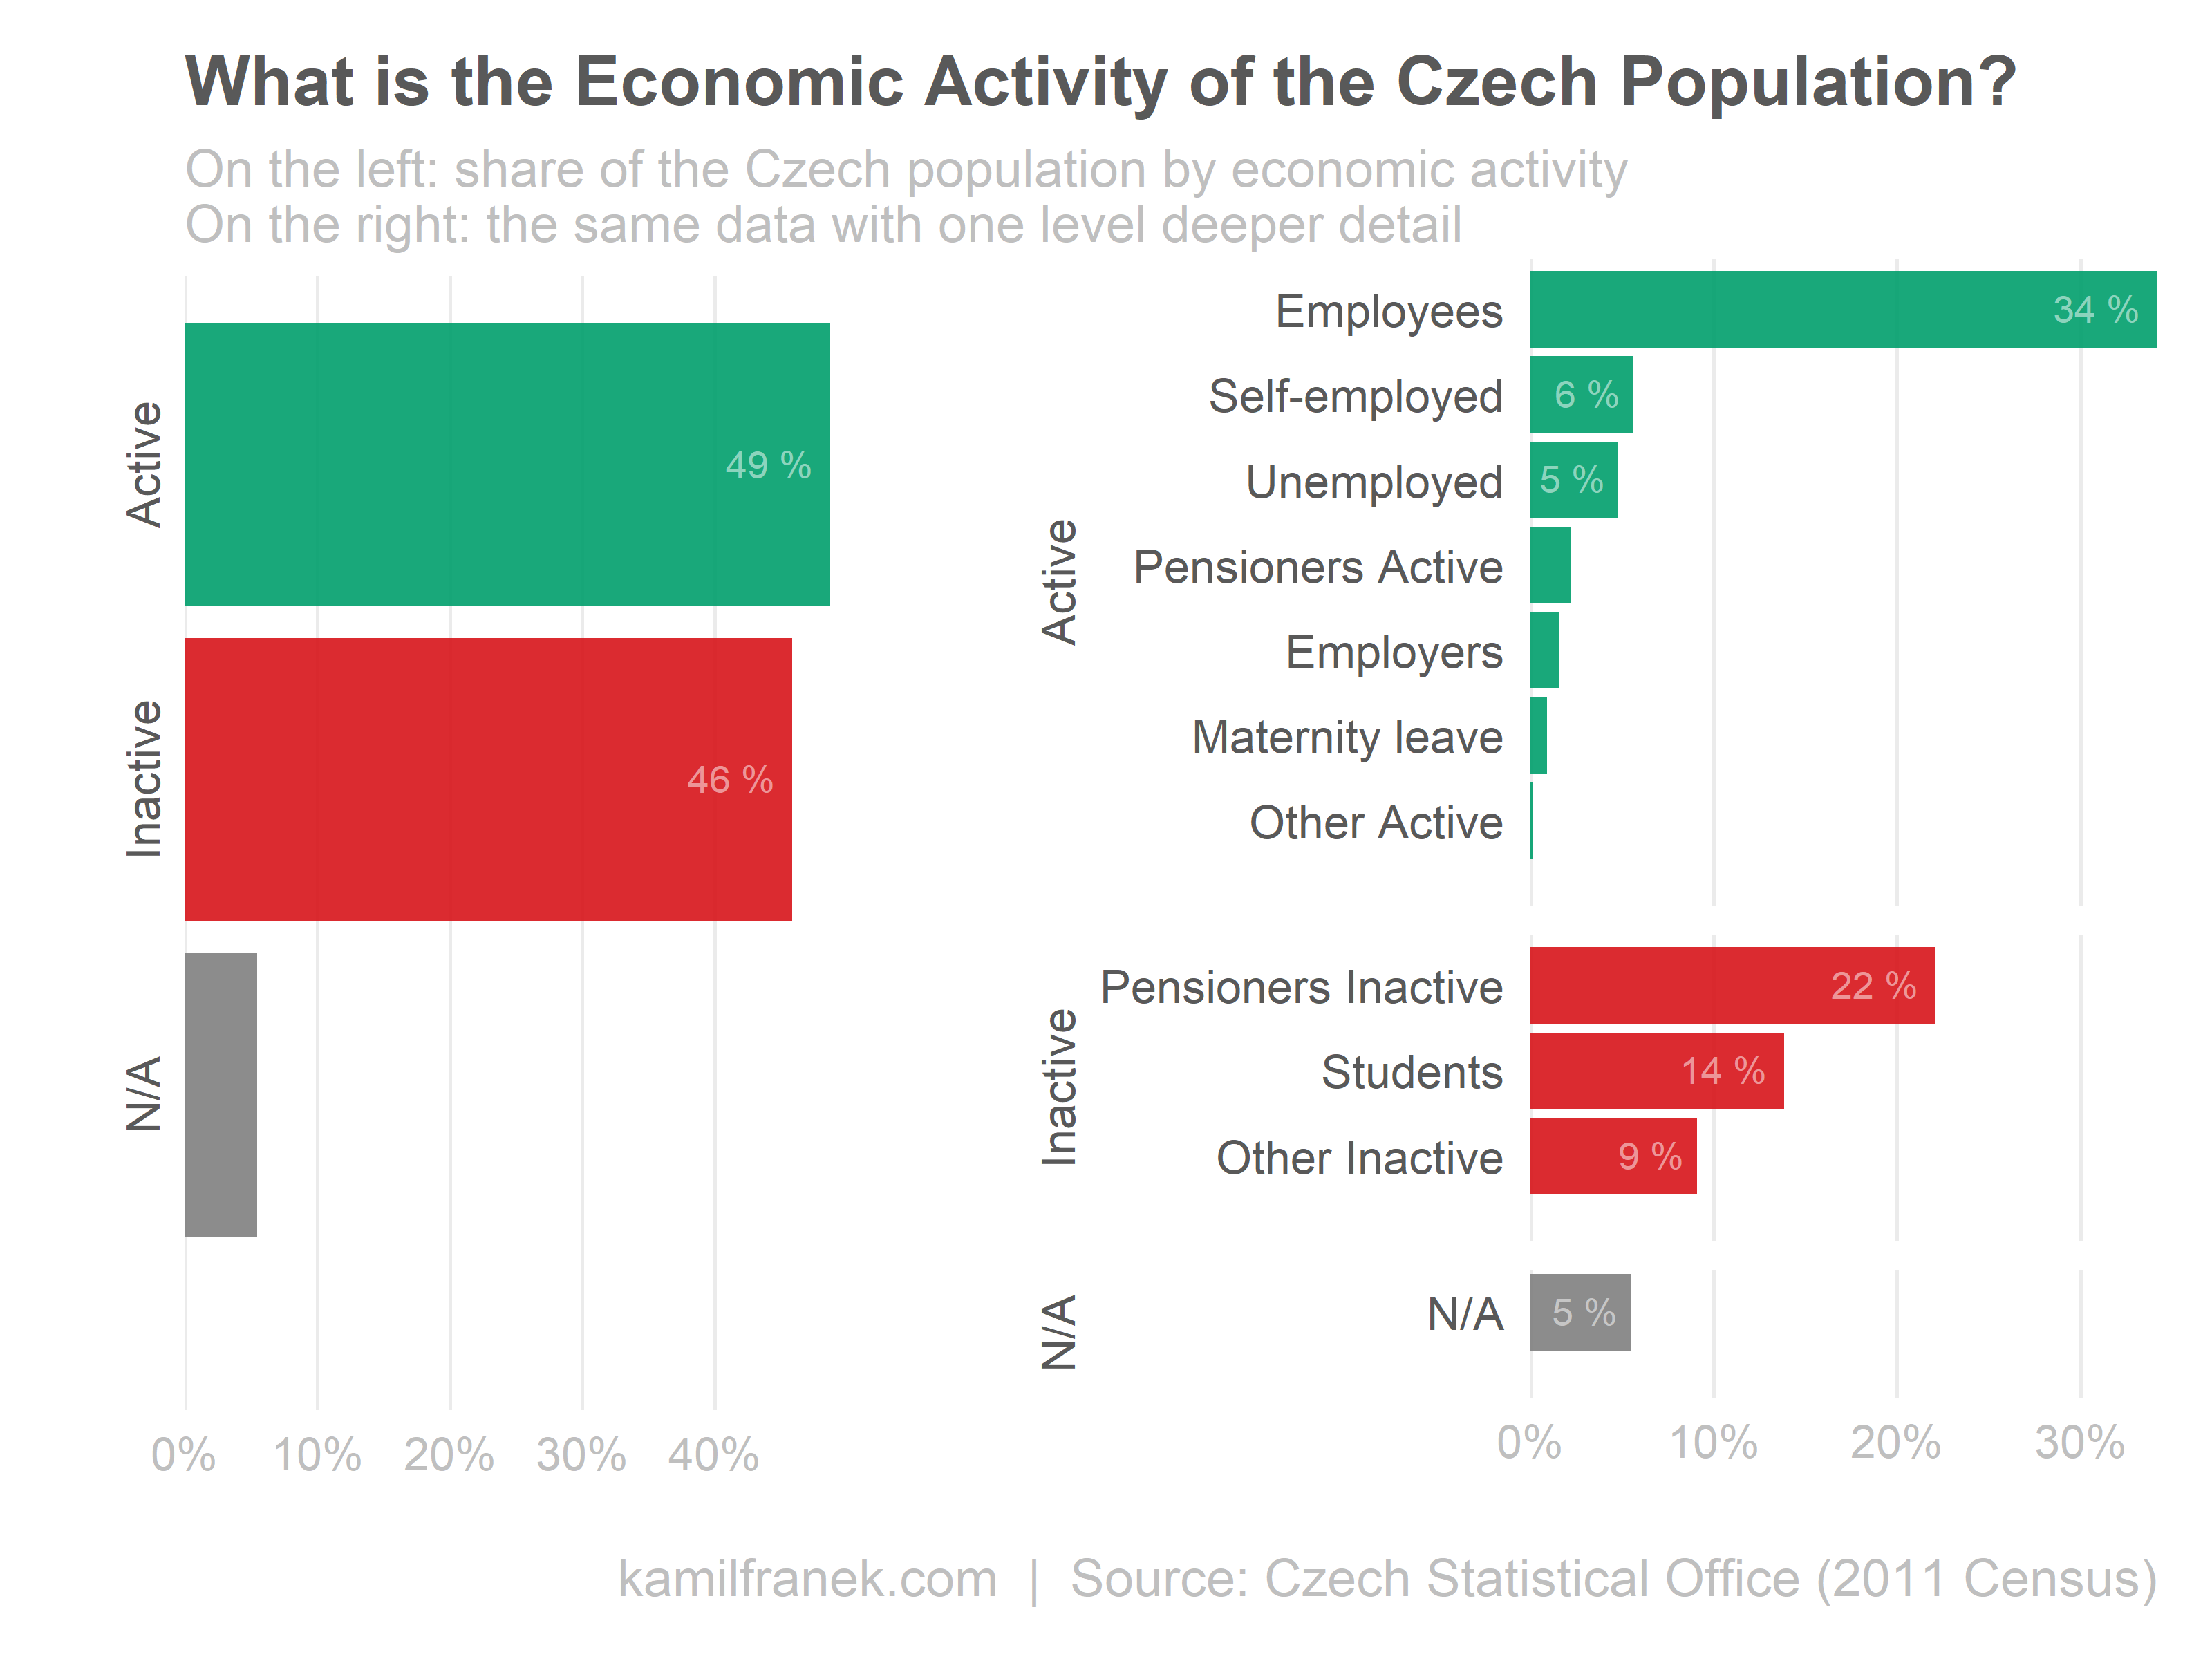
The chart above on the left shows only that population is split roughly 50:50 on active and inactive, more interesting detail emerges if you go to more granular level as in the chart on the right.
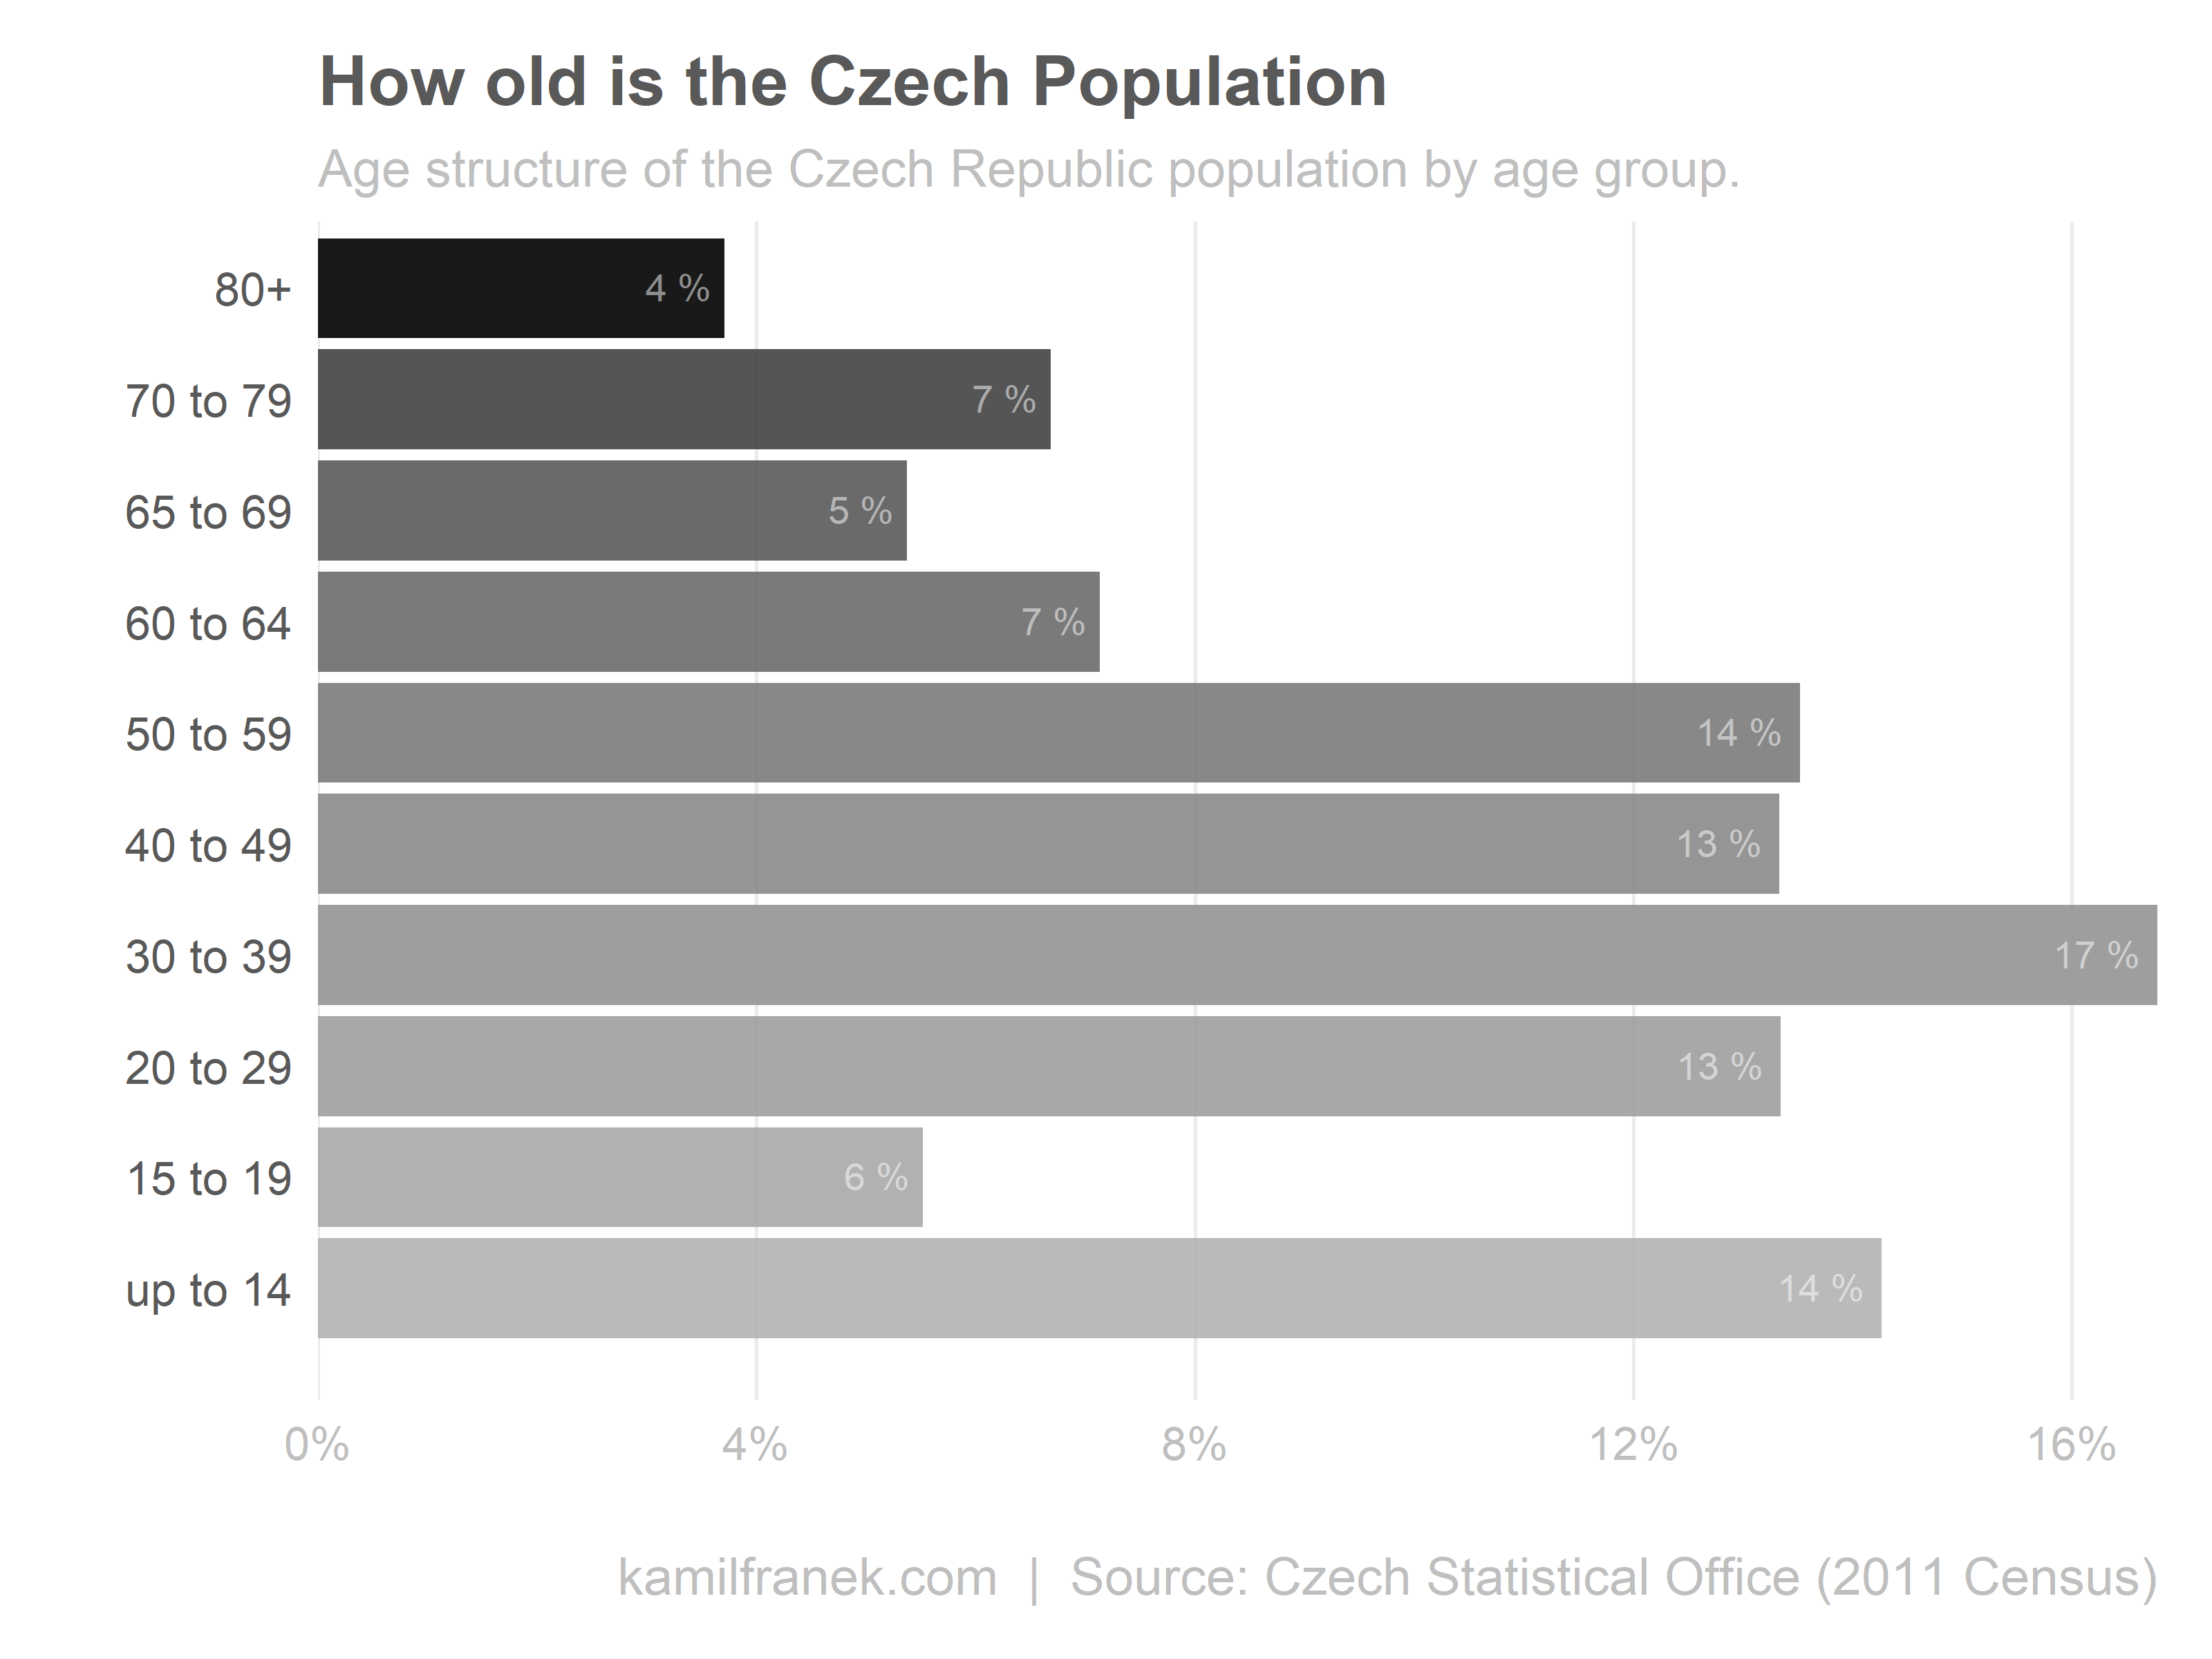
Another important characteristic I want to look at is age. Note that I’m using census data, which allows me to see the whole country at a city level. On the other hand, I have to accept that data are shifted a few years back since the last census was in 2011.
The strongest group are people born at the 70s called “Husák’s Children” after the Communist leader of Czechoslovakia at that time. A Result of population policies.
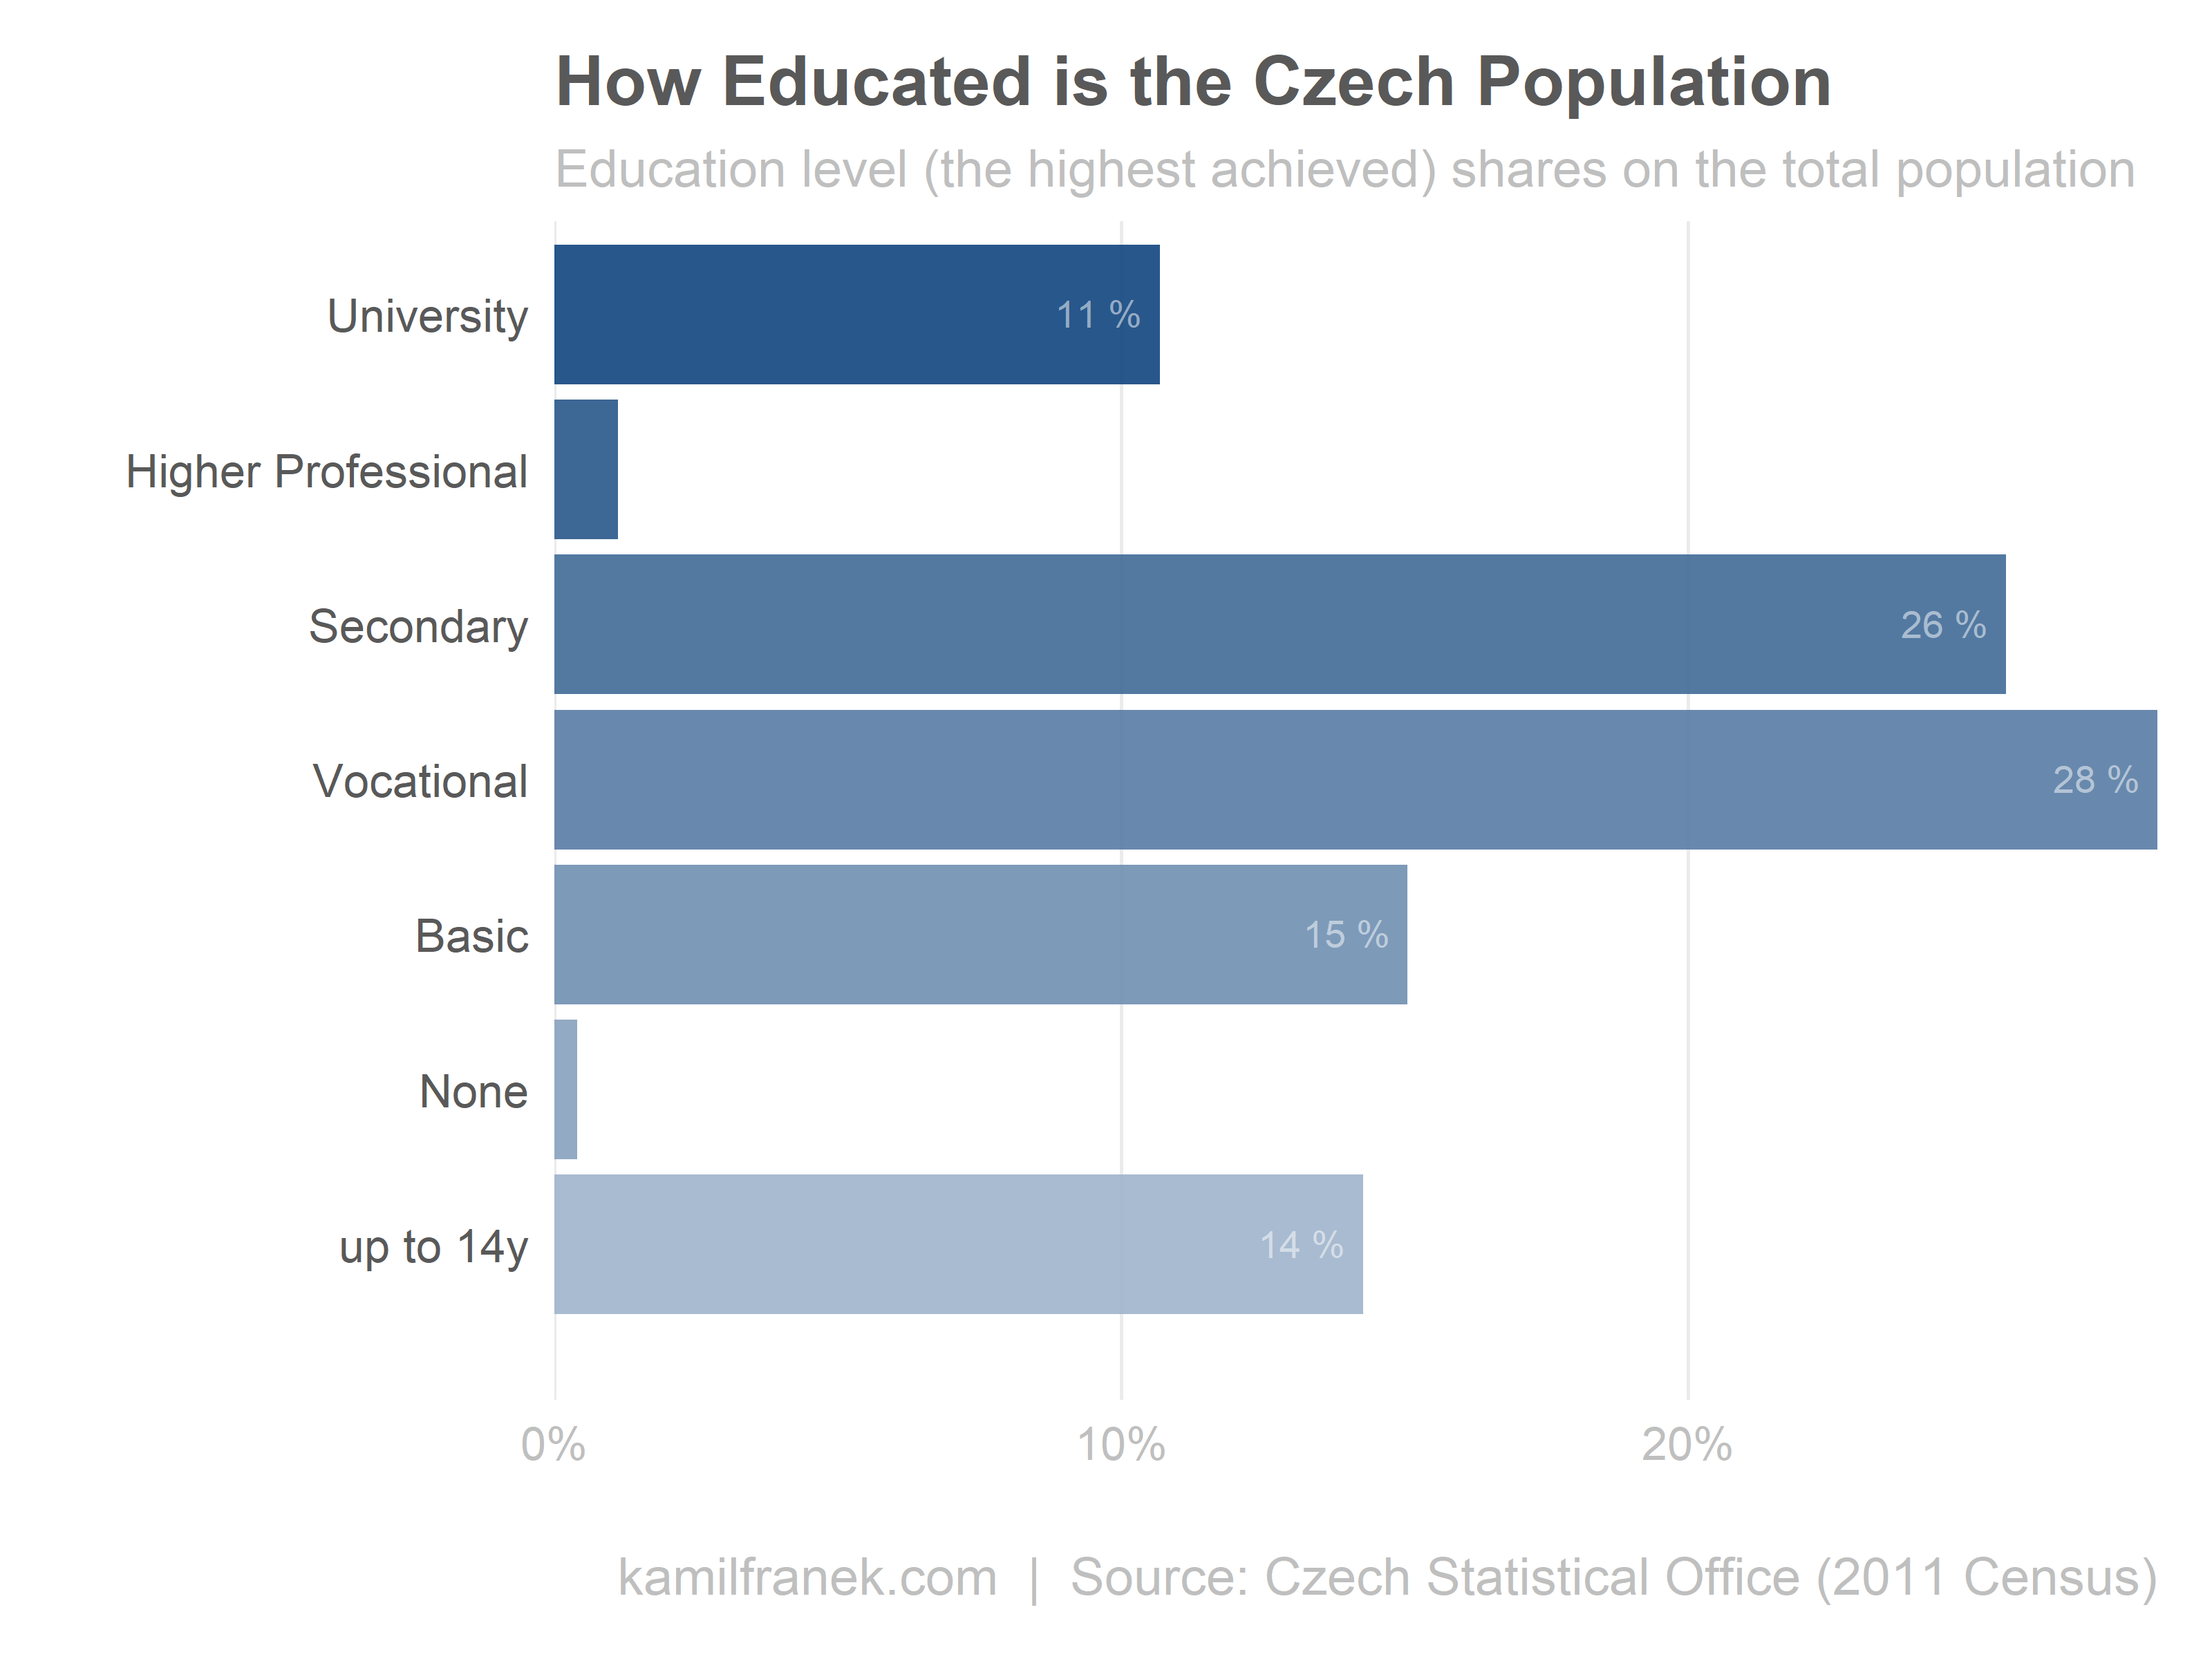
Lastly, here is look at Czechia maximum achieved education level.
Detail look at the demography of Top 10 Cities. So is the population level good rule to evaluate potential?
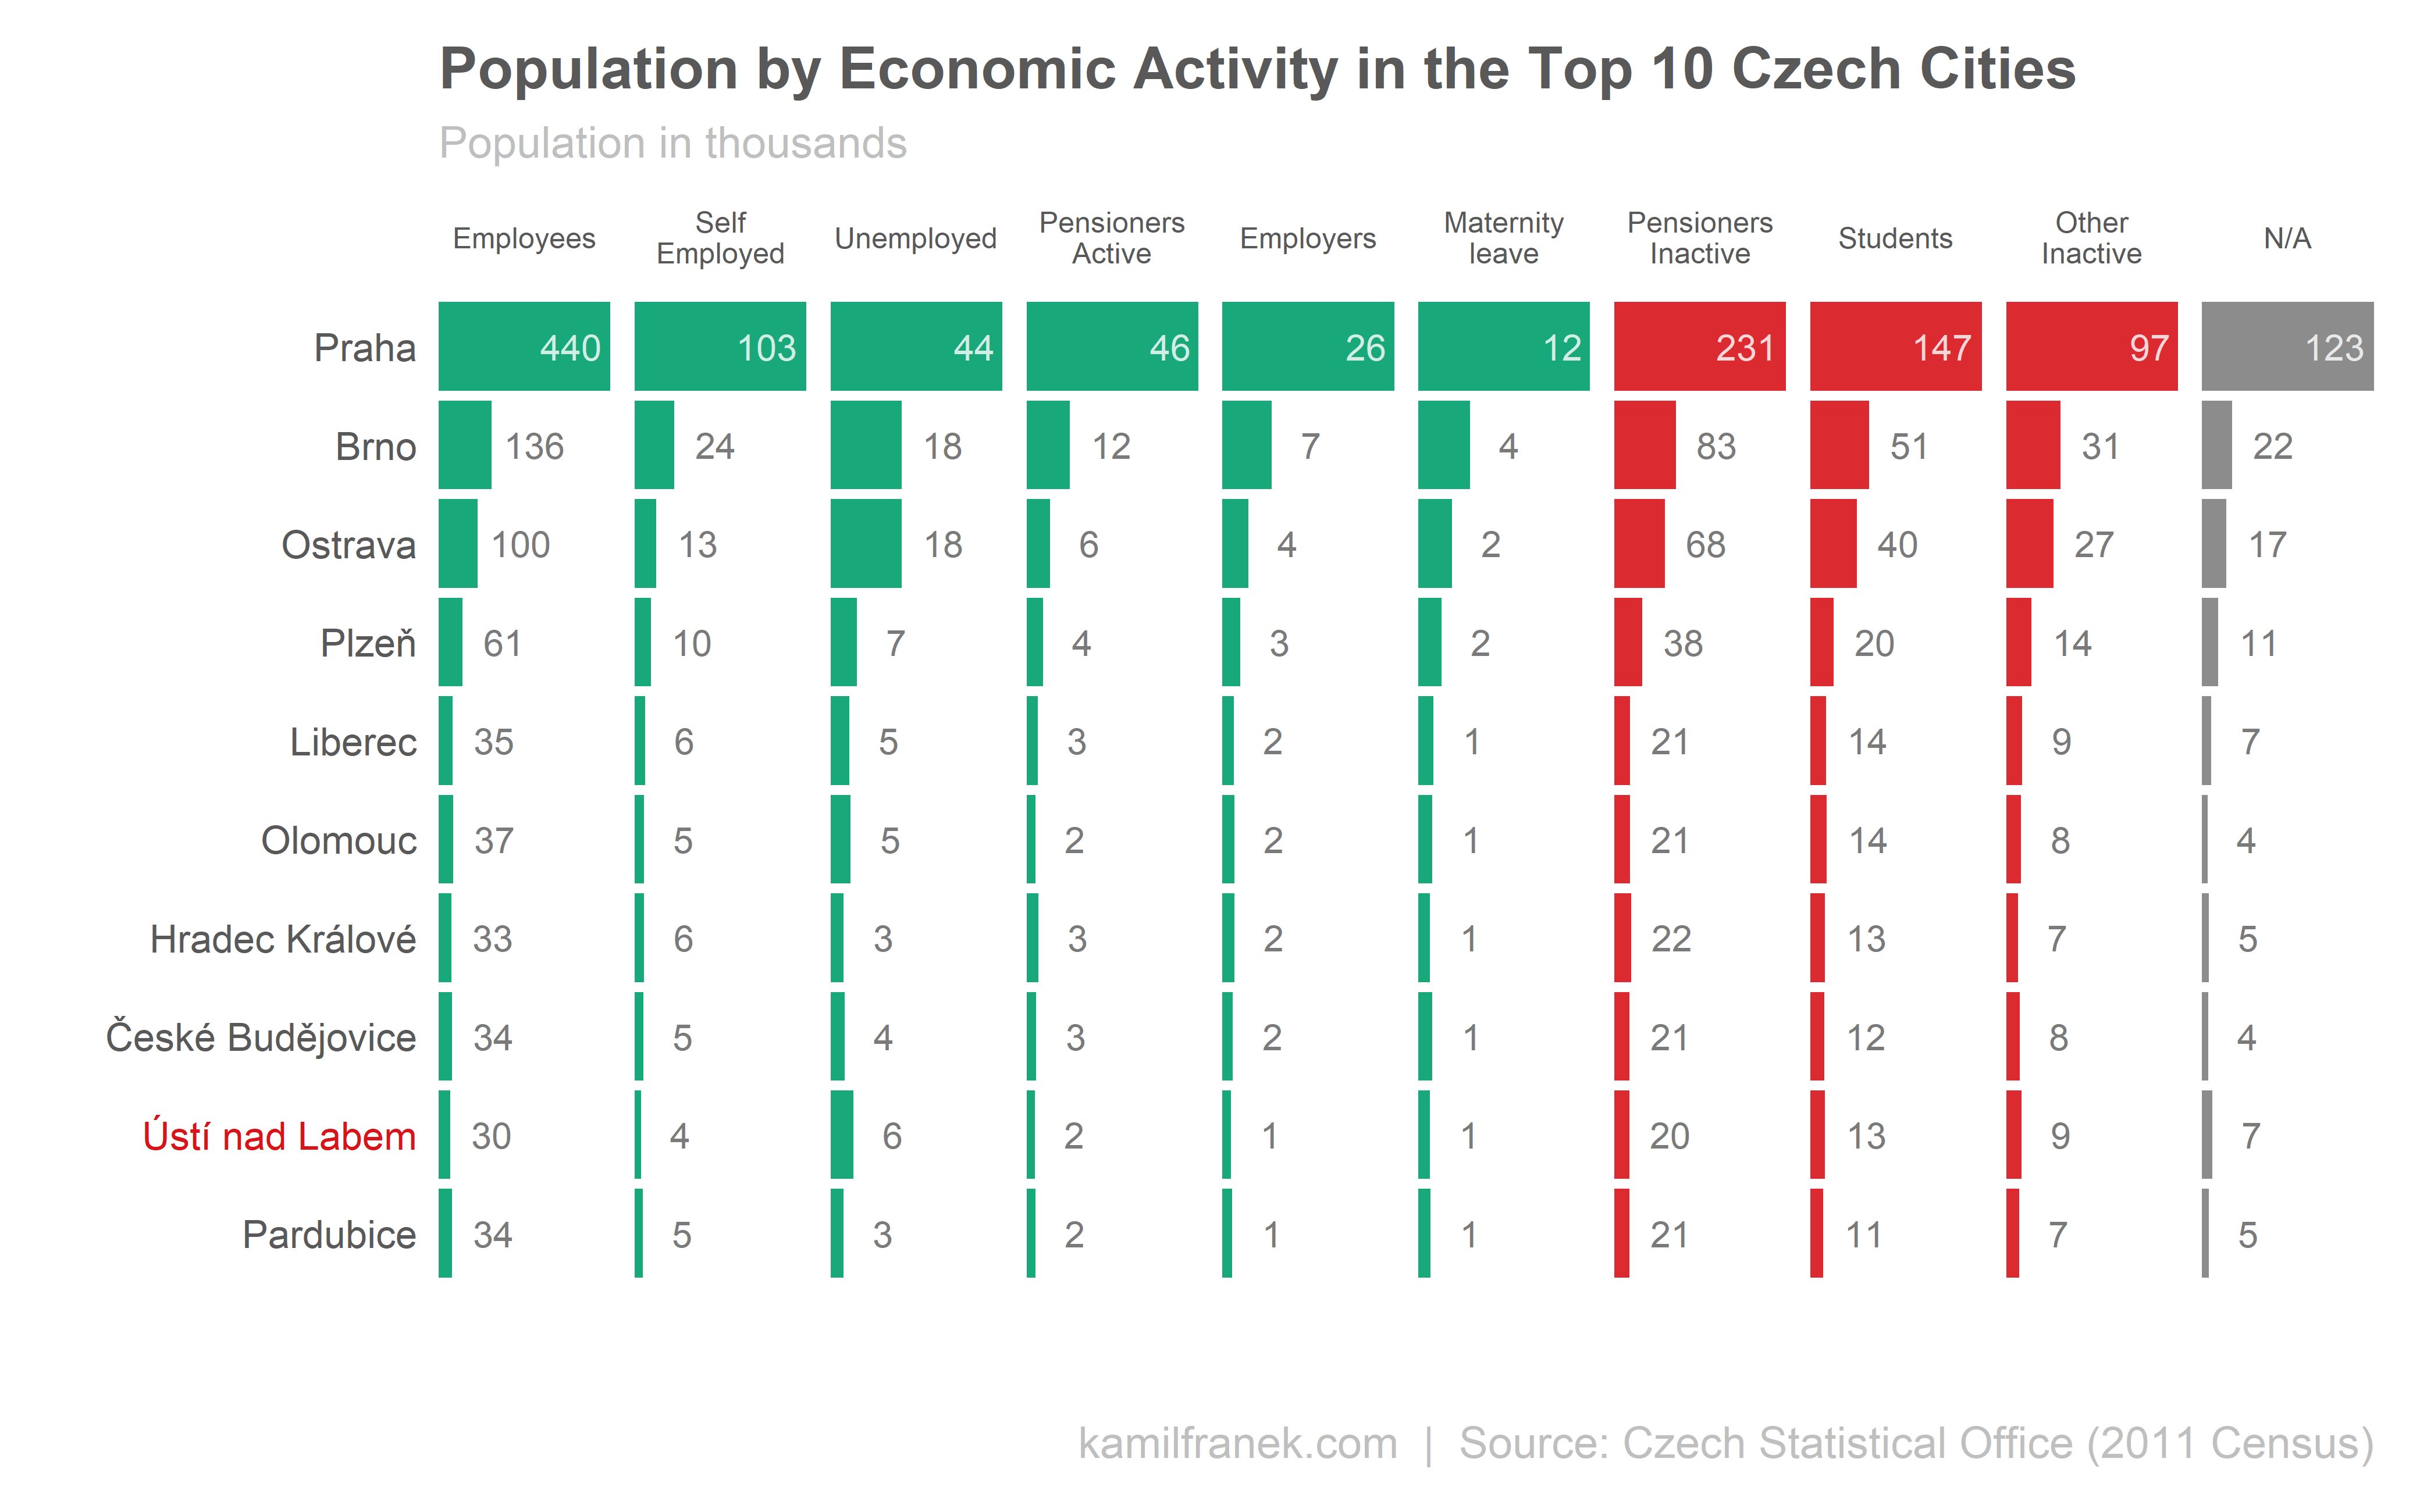
So we got an overview of Czech Republic demographic characteristic and we can now look at the same metrics at the city level. Let’s see how would ranking of the top cities for setting up your business change if we took into account key demographic characteristics mentioned earlier.

Except for a higher share of unemployed in Ústí nad Labem, it looks like our original simplified advice that more people mean more customers was roughly right. But be careful that this cant’be generalized, and we looked only top 10 cities. The Czech Republic is also small and homogenous country, so this might be relevant somewhere else.
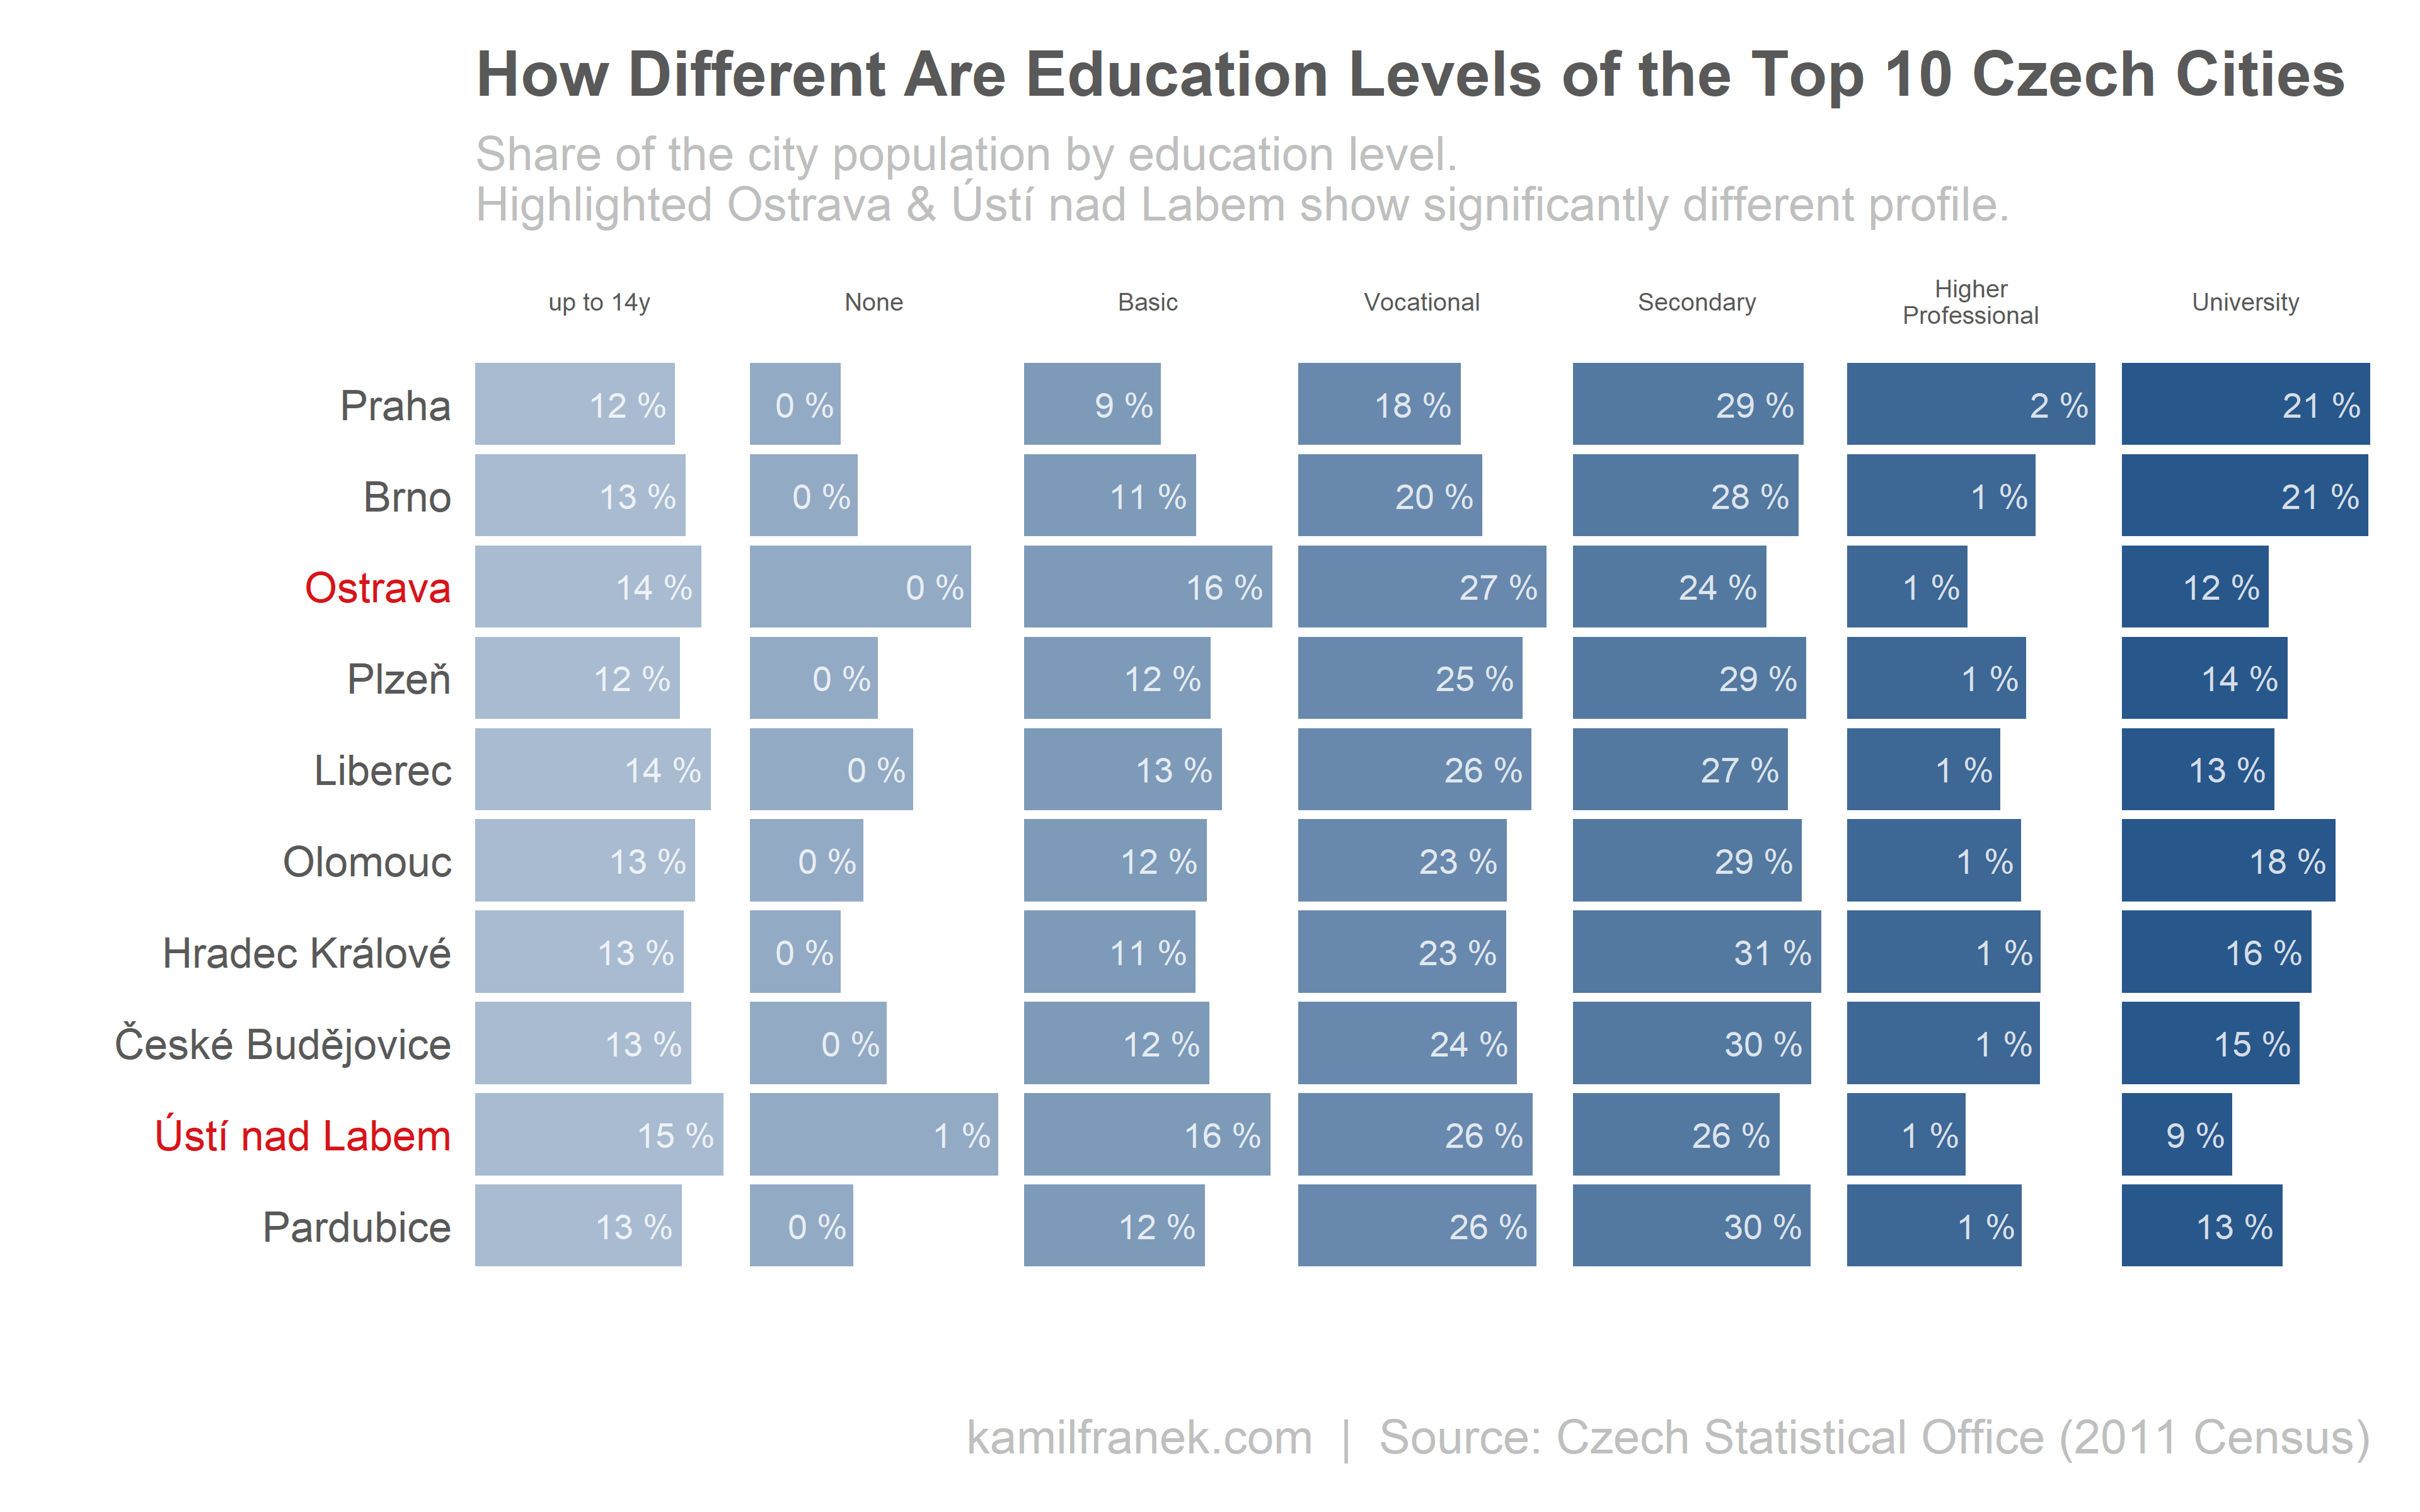
Let’s look at the same data differently as % of the total population, because chart above might be hiding some structural differences between cities.
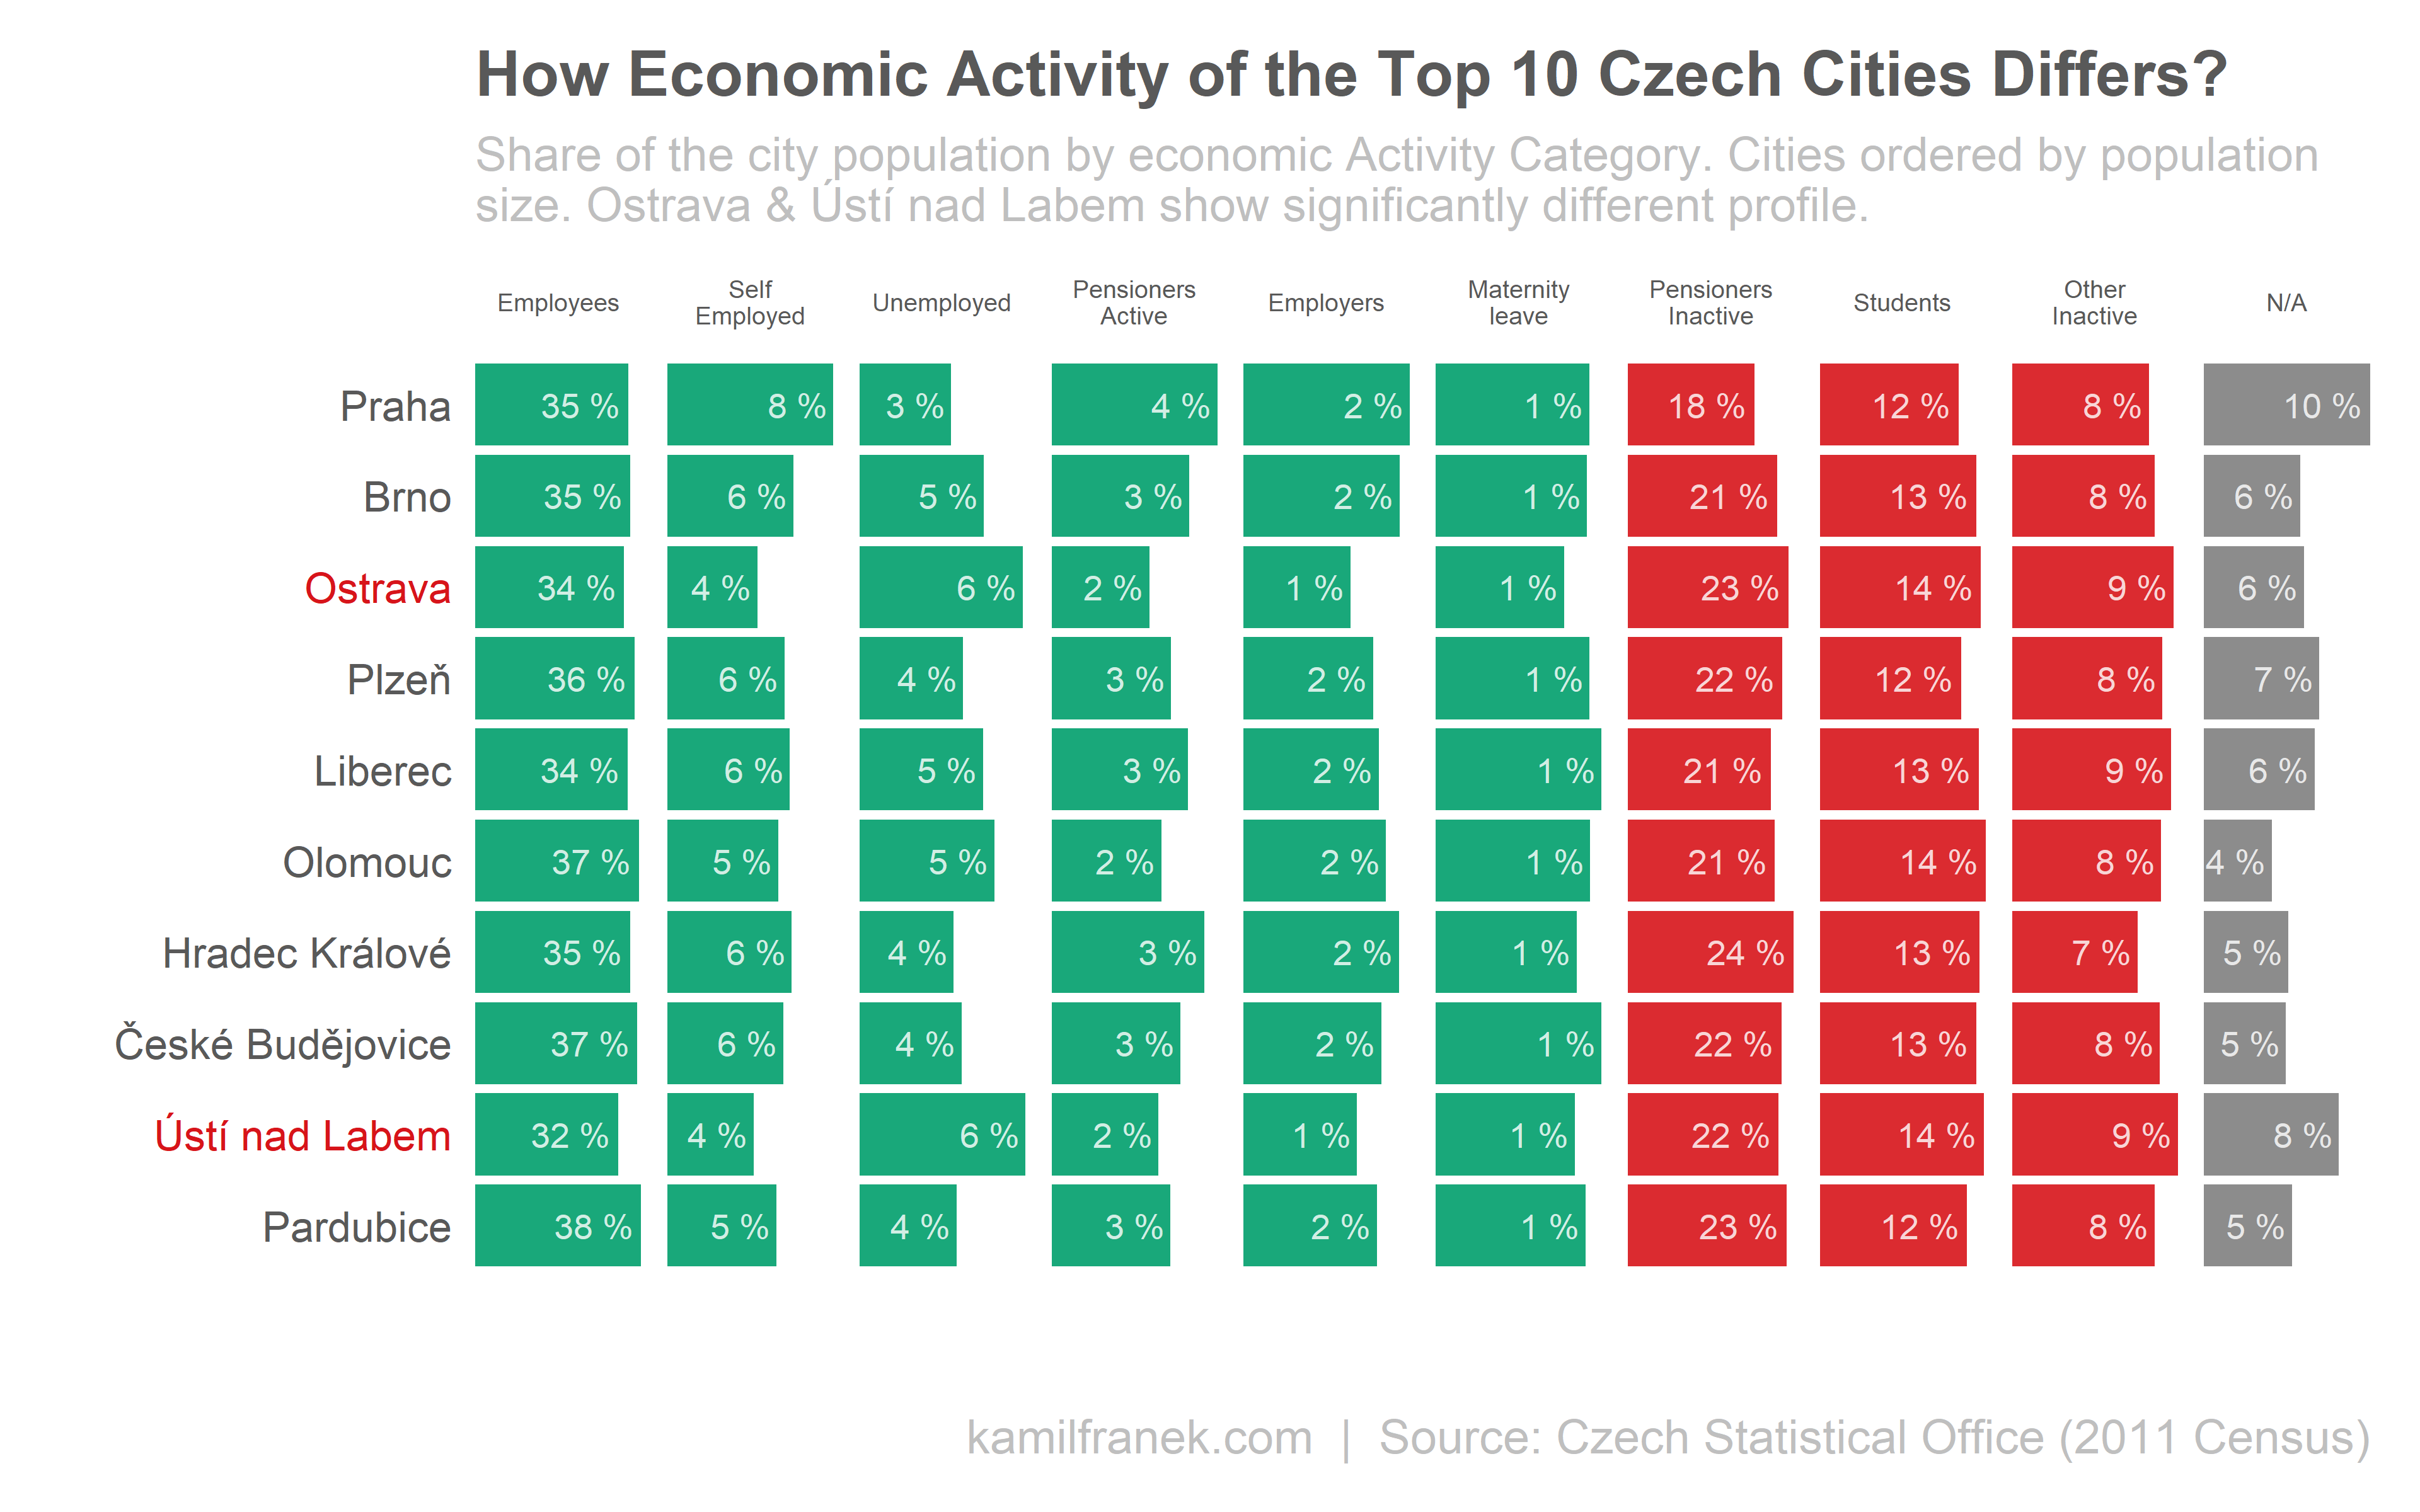
You can see that it is not only Ustí nad Labem that stands out but also Ostrava. Both of these cities have a significantly higher share of unemployed people offset by lower share of the self-employed and employed population. The rest looks roughly homogenous except the capital Praha, with a high share of self-employed and lower unemployment.
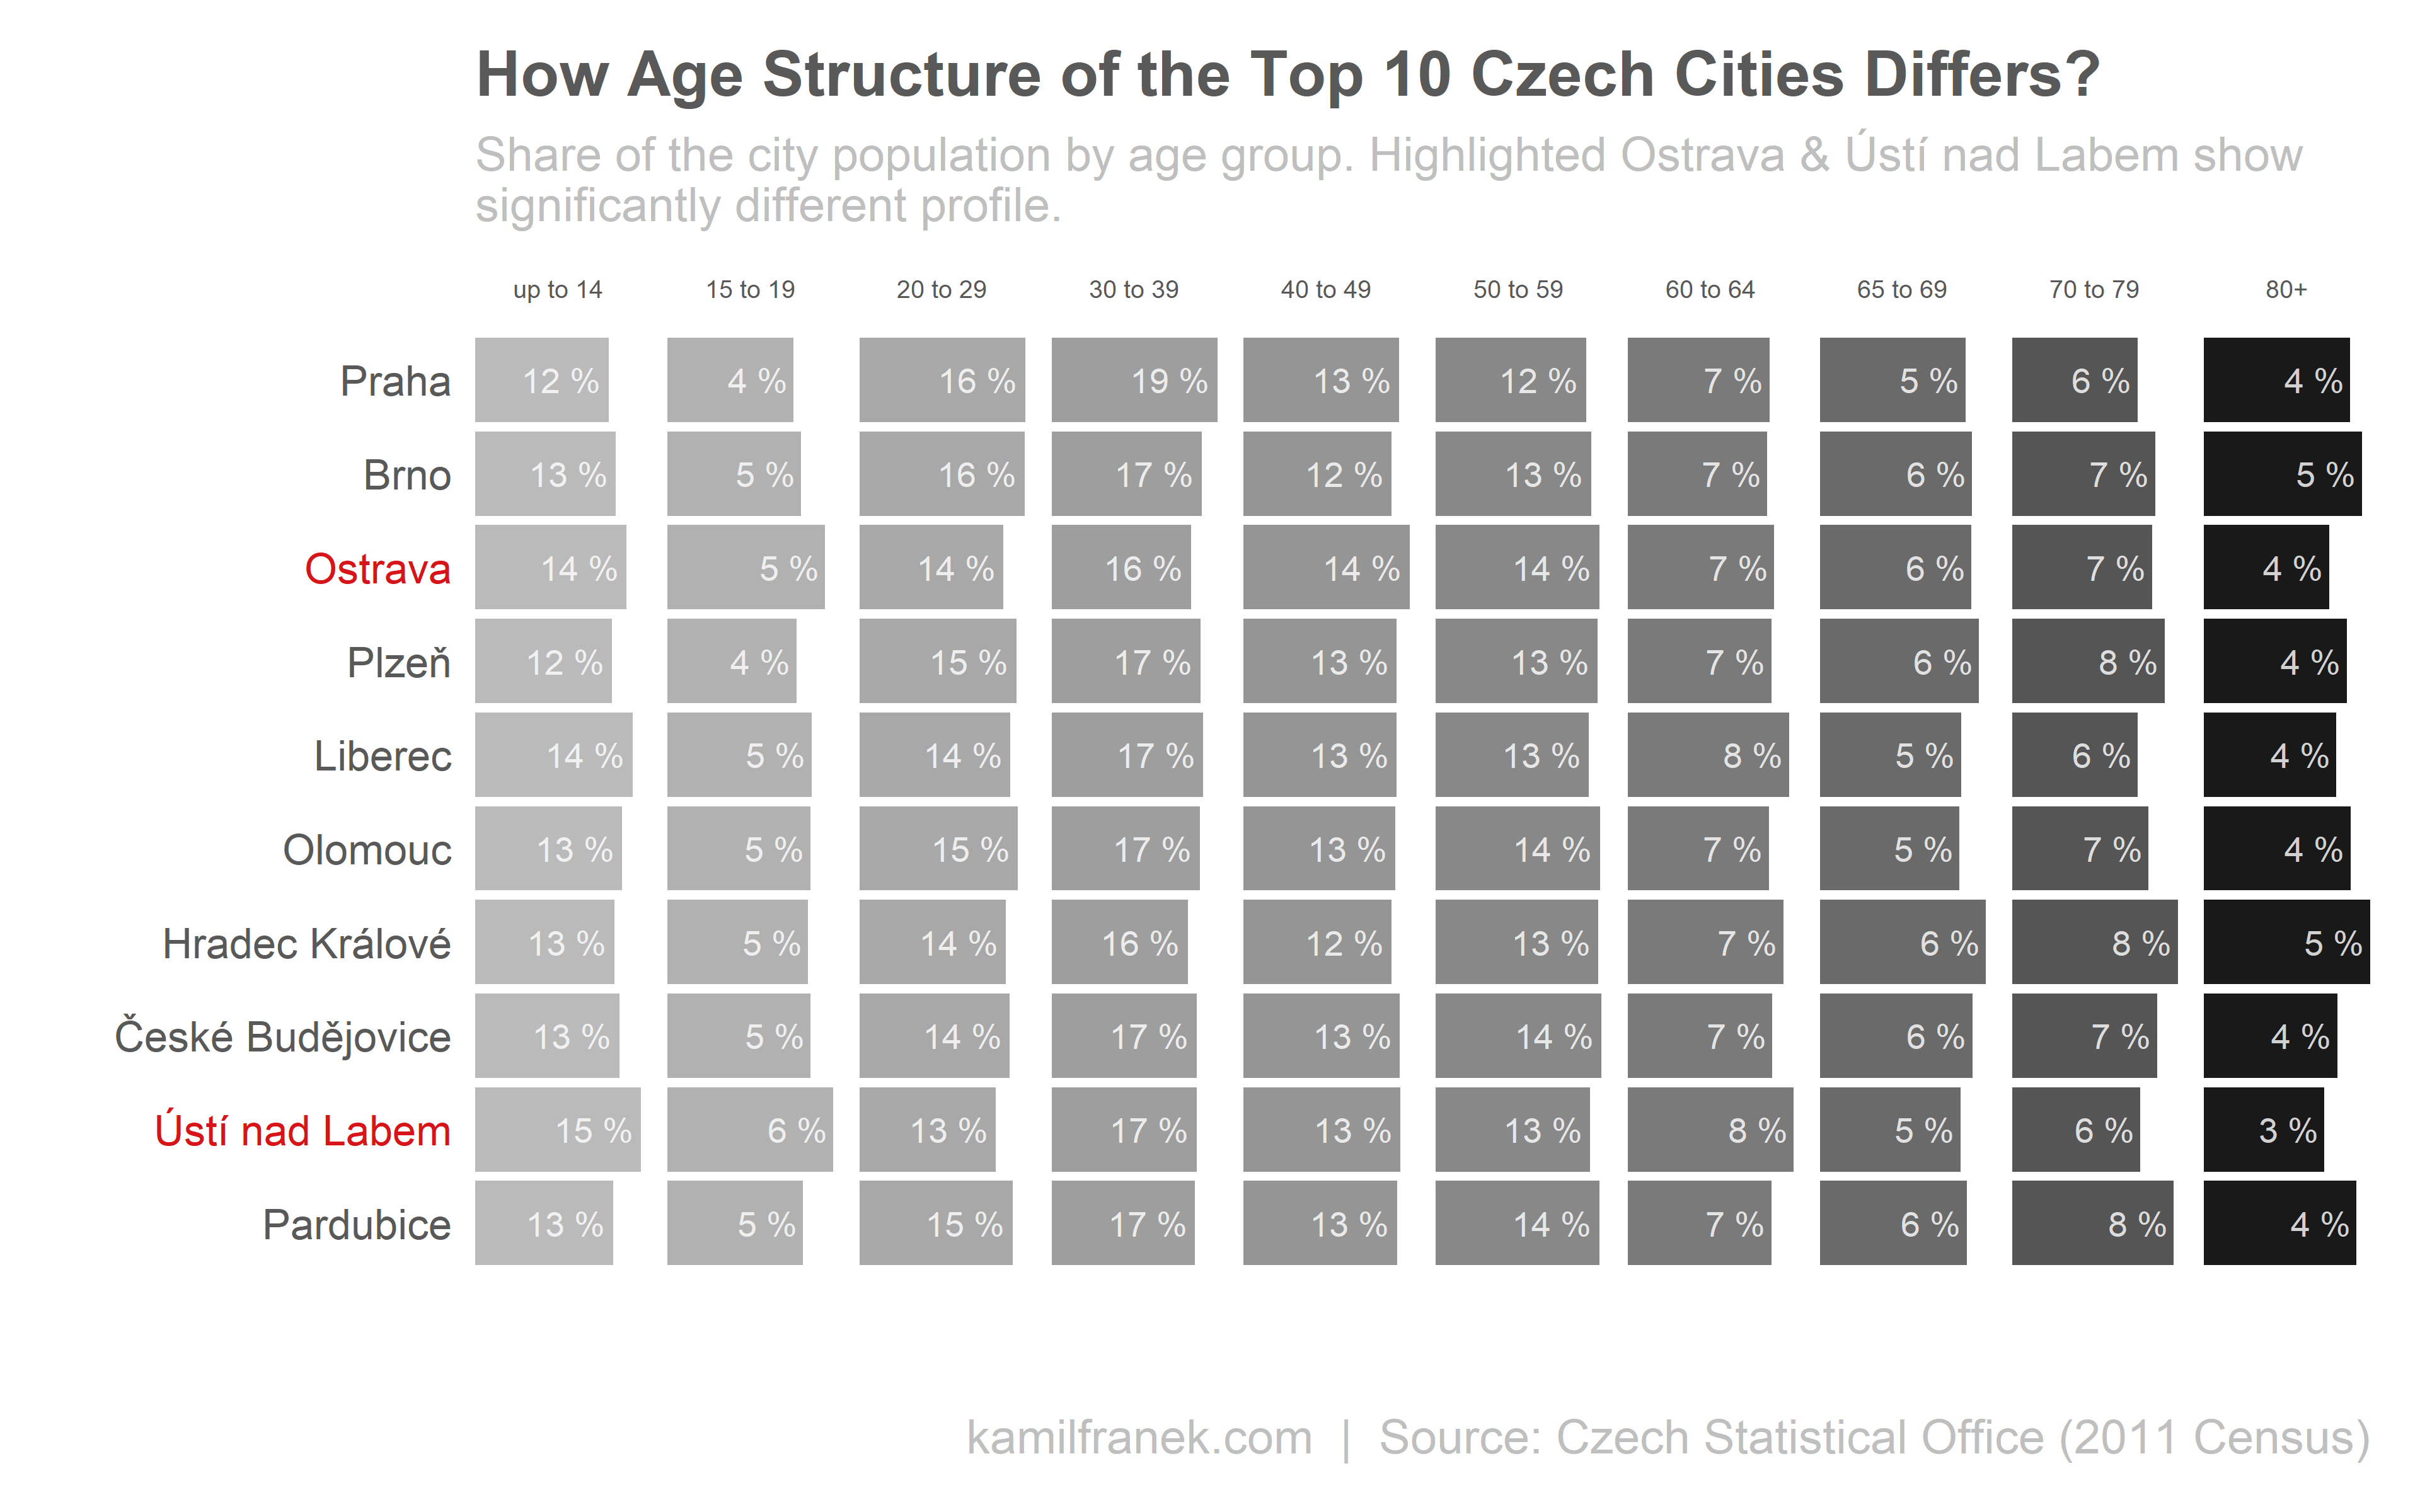
Detail split by age structure below is pretty similar across cities, but if you focus on Ústi and Ostrava again, you can spot slightly higher share of young people below 19-year-old. This is strongly connected to a higher share of unemployment we showed before. A segment of young people below 19 years usually has quite higher unemployment rate than is the population average.
The last demographic characteristic we will explore for top 10 Czech cities is education level. Again, the same two cities stand out from the rest, this time in a higher share of people with basic education and a lower share of University educated people. This also explains why these two cities show a higher level of unemployment since people with basic education level generally have a significantly higher unemployment rate.
To sum it up, we confirmed that although the rule of thumb that “business potential = population size” works most of the time, it is crucial to also look at some more detail city characteristics to avoid wrong decisions. When we looked at relative share for top cities, we found two of them (Ostrava/Ústí) have a quite lower share of the active population. We confirmed that these cities also have a younger people and a lower level of formal education. All these characteristics are characteristics generally connected with higher unemployment.
Does it mean that you should avoid these two cities and prefer a city with the lower population and with a higher share of an economically active population? For Ostrava, the answer is no, because size difference to 4th Plzen is so significant that differences in the population structure won’t outweigh it. In case of Ústí, if we would look only at self-employed or employed segment as crucial for our business we would probably do better by prioritizing smaller Pardubice. Difference between the population of Pardubice and Ústi is little, therefore relative differences make up for it.
It is important to say, that it all depends on who are your customers. Demographic might give you rough guidance in this but more niche your business or customers are, more important will be detailed customer segmentation in given city using multiple characteristics at once.
For example, if you sell toys, you will prefer to have a presence in cities with a higher share of children and also higher economic activity level of their parents to make sure that they can afford to buy your toys for their children.
What if your business is online, you might think, do I care about the geographical distribution of my customers? You don’t, but the underlying logic is similar. You don’t care about a number of teenagers in different geographical locations, but you care about a number of teenagers across different online territories, e.g. how much teenagers are active on Facebook vs. Snapchat.
How Do Population Characteristics Look Outside the Top 10 Czech Cities
So far I concentrated only at few top cities, but top cities have different demographics that the rest of the Czech Republic. It is true that 25% of the Czechia population live in the top 10 cities, but most of the population still live outside of the top 10.
If we want to look visually on the whole Czechia by a city, it is where the granularity of census data really shines and allows you to have a detailed picture by a city. We do not need to rely on less granular data by regions, which might hide some local differences.
Two “twins” heat maps below are inverse to each other and are showing the self-employed share of the population versus share of the unemployed population.
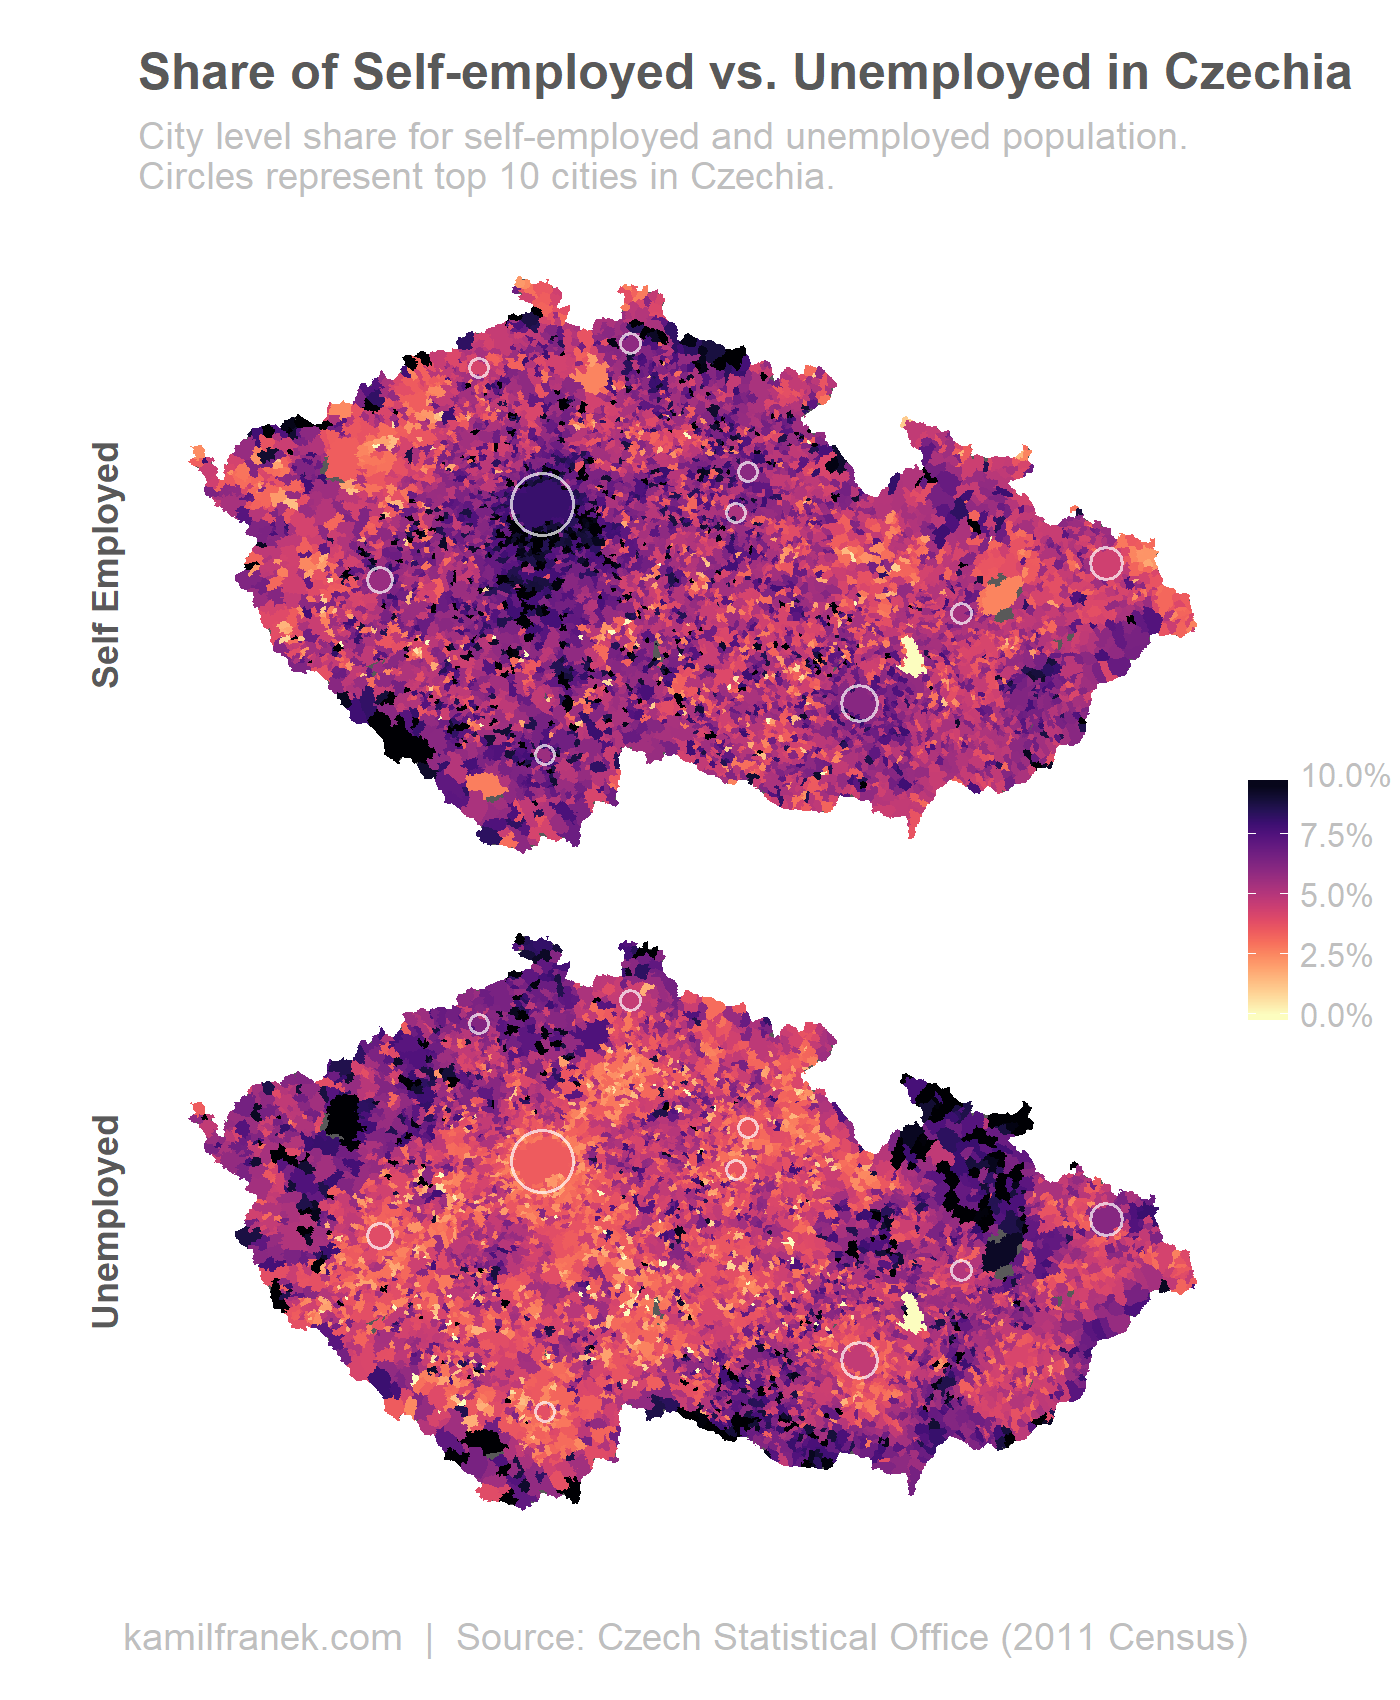
Heatmap above gives a general overview. Be careful that the smaller the area, the more common it is to see some extremely low and high values. This is a quite normal phenomenon because by chance it is much more probable to achieve extremes shares of unemployment in smaller cities than in bigger one. Similarly, if you toss a coin ten times, you have more significant chance to reach a higher share of heads compared to the situation when you would toss a coin 10 000 times. In the latter case, it would be quite unusual (with fair coin) to differ too much from 50%.
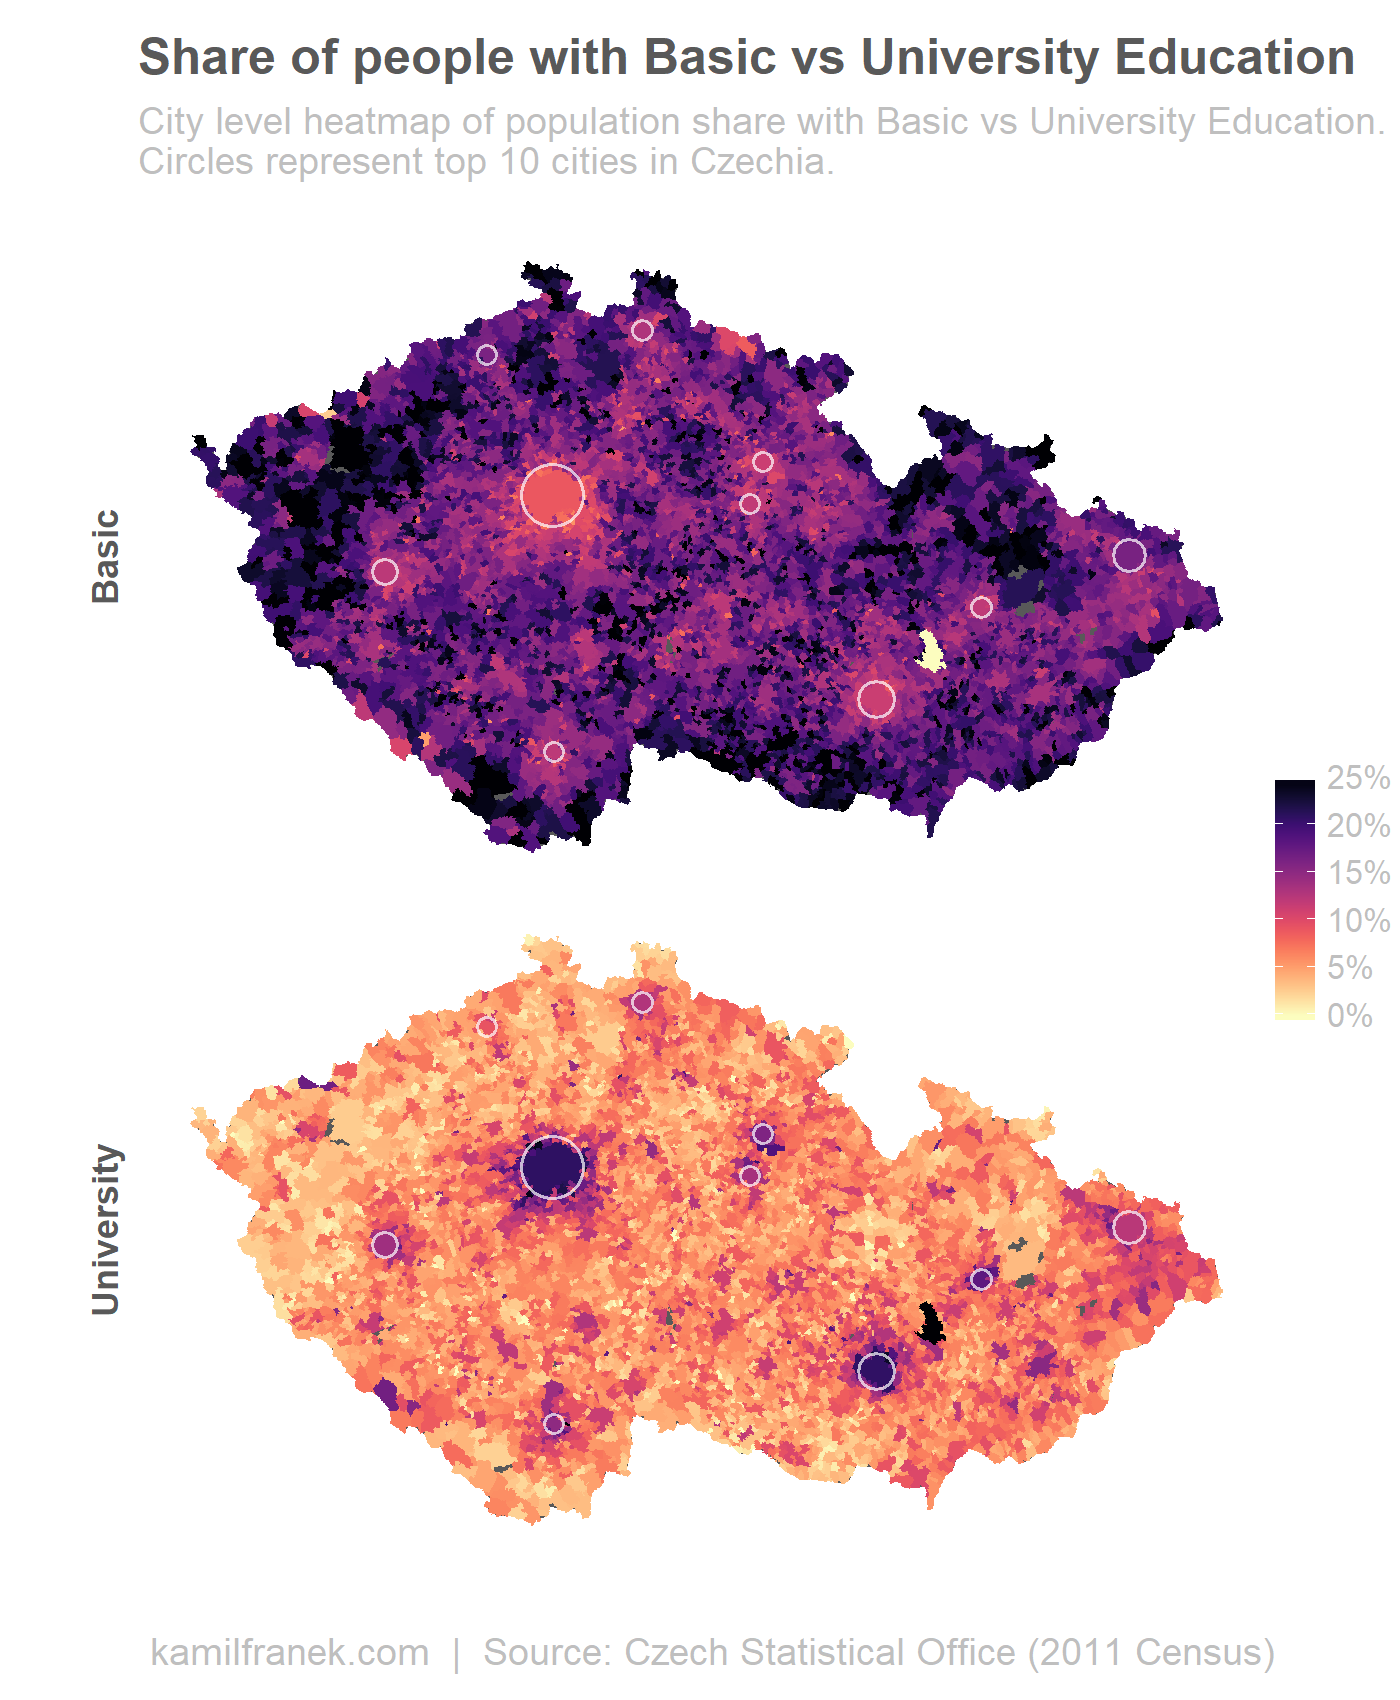
Below is similar heat map “twin” map visualization comparing the share of people with basic vs. university education. Bigger cities clearly stand out with two exceptions (Ostrava + Ustí nad Labem).
References:
Czech Statistical Office (2011). Selected data from 2011 Czech Republic Census (26. 3. 2011). https://www.czso.cz/csu/czso/otevrena_data_pro_vysledky_scitani_lidu_domu_a_bytu_2011_sldb_2011.
Geoportál ČÚZK (2017). INSPIRE harmonized dataset on Administrative Units. http://geoportal.cuzk.cz.
Charts in this article were created using R and ggplot2.